
(Century Foundation graph here) In 1968 a 40 hour week's pay at minimum wage income would buy an month's apartment rent in 36 of 50 states; today no state.
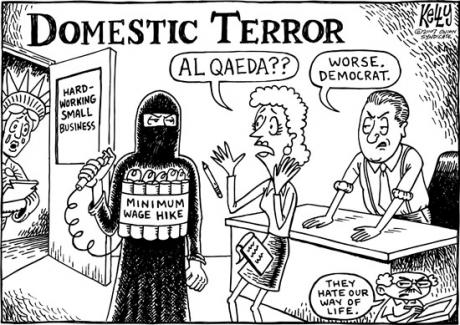
A $22.81 per hour Minimum Wage?
That would be a $41,000 per year for full-time year-round workers.
At $22.81 this would triple the existing minimum wage which now is $7.25 an hour. So, $22.81 is unrealistic. It would be an utter disaster for many firms who couldn’t make payroll, and it would cause massive unemployment. But there is another way to do it. First raise the wage to between $10 to $12.50 an hour, and then increase the Earned Income Tax Credit (EITC) to effectively lift the minimum to $22.81.
Three years ago I wrote about a report from scholars at UMass/Amherst who propose an increase to $12.30 an hour while doubling the benefit of the EITC. Read my essay here.
Why so high? This is what the minimum wage would be if it had kept pace since 1968 with both inflation and economic growth. It would be triple today’s rate. And why is that important? It would reduce much of the suffering in our nation. We have very high, unnecessary and growing poverty. Half of U.S. workers receive in wage income less than 6% of personal income, and a full 46% of all workers receive less than $25,000 a year, and this lower-earning half has an average worker income of $10,000 per year. Nano assets characterizes nearly half of the U.S. population; 44% of households and U.S. citizens are liquid asset poor, equivalent to less than $6,000 for a family of four. The average per worker income is $90,000 -- simply divide total personal income by total workers ($14 trillion divided by 155 million workers equals $90,322 per worker. Admittedly its much more complicated than that, but $90,000 is still the mathematical per worker income.). The bare majority of Americans have a bare minimum of solid economic security. (See here for GDP per capita increase of 116% since 1968 and here for inflation calculator)
$690,000 is average household savings ---
We could eliminate poverty on the other hand. Security matters. Wealth for instance is a nice security blanket. On average most Americans don’t have it, but the average savings is almost $690,000 per household. (See here page 17 and here page 2, updated to 2013 Q4) Less than ten percent of households have that amount. Imagine your life with $690,000, the average savings, in your bank account and the same for most of your neighbors -- some higher and some lower, but most around “average”.
$200,000 of new savings per household in last five years!
Since 2008 the nation's households have increased their savings by $23.5 Trillion, about $200,000 per household! ( See here again, page 2.)
We can create this widespread affluence because we already have affluence, $80 trillion in private savings, it’s just sequestered at the top. To make it broadbased is doable, affordable, and practical. It only lacks popular will and political power. Big money owns our news media and politics. When, for instance, have you read about possibly raising the minimum wage to above $20 an hour? Or of redistributing the nation’s wealth or income? Or eliminating poverty in a nation where the average household savings is over $690,000? Who controls the press and the politics? We are very wealthy, we are a democracy, why doesn’t it come to the minds of every citizen that we can and should eliminate all poverty? On average every citizen has over $250,000 in savings.
Good article on Min. Wage Basics here.

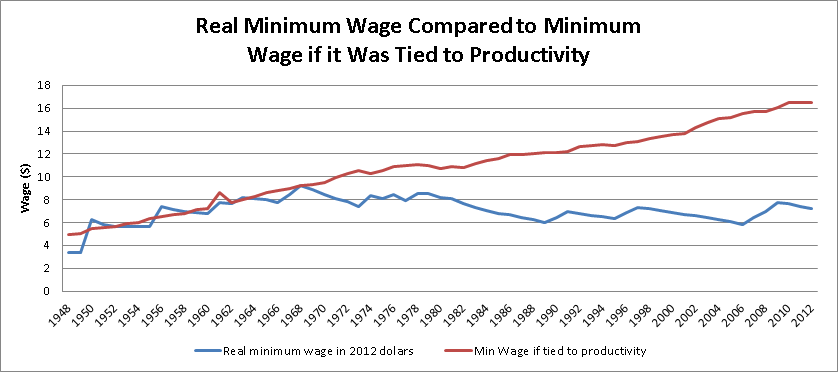
In 1968 the minimum wage adjusted for inflation was $10.56 per hour. Adjusted for economic growth it would be $22.81. Productivity has increased; workers create more each hour and their products last longer and travel faster. Think of cars, airplanes, light bulbs, fiber optics, pharmaceuticals, by-pass surgery, plastics, cable TV, lap tops, the Internet or pretty much everything. Total output grew by 116% per citizen between 1968 and 2012; this is another measure for worker productivity. A full-time and year-round minimum wage worker would be earning $41,058 today, a higher income than 65% of workers today. A boost to $22.81 would lift the incomes of over 65% of all workers, not just the small portion who earn minimum wage.
Today’s full-time and year-round (FTYR) minimum wage worker earns about $13,000 today, not $41,000. And 84% of workers earning minimum wage are older than 20, see here.
Since 1968 wages have increased by only 4% and the economy per human has expanded by 116% -- that's the long and the short of it.
Who suffered? Who benefitted?
A think tank that produces reams of statistics on wages and income, the Economic Policy Institute and its subsidiary State of Working America, reports that between 1973 and 2011 weekly earnings for non-supervisory employees increased by less than 3% -- while, of course, the productivity of workers increased by about 116% (see Table 4.3). From 1973 to 2011 wages for the 50th percentile worker increased by 4% (Table 4.4). The graph of Table 4.B shows no movement between 1970 and 2010, 40 years of stagnant wages, while the economy's productivity per worker more than doubled.
Real hourly earnings and compensation of private production and nonsupervisory workers, 1947–2011
 From Laurence Mishel's report here, The wedges between productivity and median compensation growth. If any article describes the dynamics, it is this one.
Note: Hourly compensation is of production/nonsupervisory workers in the private sector and productivity is for the total economy.
Note: Private production and nonsupervisory workers account for more than 80 percent of wage and salary employment.
Source: Authors' analysis of Bureau of Economic Analysis National Income and Product Accounts data and Bureau of Labor Statistics Current
A numerical fusilage
The following is a numerical barrage that may disinterest some readers.
In 2012 (the most recent Social Security Administration report on wage income) the mean average annual wage income for all workers, 153 million, was $44,226. And the median annual wage income (or middle worker, half of workers earned more, half earned less) was $27,519 per year. The total combined income in wages for half of U.S. workers was less than 6% if all personal income, and half of all households earned only 17.6% of all personal income (see here page 33). Median household income since 1968 is up by 14% (or $6,000) and the mean average is up by 41% (or $20,600), meaning the majority of gains has gone to the top. And the collective total income of 1% of households exceeded that of 60% of households. If wages had grown at the same rate as the GDP per capita rate since 1968, by 116%, the mean average yearly wage income would be $74,468, not $44,226, and the median yearly wage income (at 65% of average) would be $48,404 instead of $27,519. Half of U.S workers would be earning over $48,000 per year.
The lowest FTYR income could be $41,000 per year, and a $22.81 per hour minimum wage could be the reality. Presently 18 million workers, about 12% of workers, work FTYR at wages below the poverty line for a four person family, see here. They are working poor in a very wealthy nation. This essay is an exercise in counterfactual conjecture -- what if -- and the “what if” deserves consideration. If the progress in poverty reduction that began in the 1960s had continued throughout the 1980s and beyond, poverty would be extremely low today.
The EPI states,
" Before the mid-1970s, economic growth in the United States was associated with falling poverty rates. If that relationship had held, poverty would have been eradicated in the 1980s. The decoupling of rising growth and falling poverty, however, means that Americans are working longer and harder but becoming poorer and less economically secure.” - See more here
______________________________________________________
______________________________________________________
This graph was created by the CEPR.org in 2013. Their conclusion is less than mine. And this graph from the 2012 report linked to at the top of this essay.
___________________________________________________
Average Worker Income -- $90,000, or $56,464 cash income.
Why should half earn on average $10,000 per year?
Average Worker Income -- $90,000, or $56,464 cash income.
Why should half earn on average $10,000 per year?
Today 47% of U.S. workers earn yearly less than $25,000 in wages. That's about 72 million workers out of a total of 153 million who are either in poverty or on its verge. Each worker contributes $90,000 to the personal income total above $14 trillion, and about $116,000 to the total GDP which about $16 trillion. After taxes each citizen could receive $39,000 in income in 2013 Q4 according to the BEA.gov stats on Personal Income. That’s roughly about $160,000 income for a family of four. Personal income is complicated, another measure, cash or money income, places per worker income at $56,464, not $90,000. The Citizens for Tax Justice places per household "cash income" at $75,100 for 2012. All workers --- the 10 million unemployed, the 29 million part-time workers, and several million partial year workers --- contribute $90,000 per year to total personal income. Or $56,464 in cash income, if you prefer. The EPI states that average household income in 2007 was $104,163 (see the table), considerably higher than the "cash income" of $75,100. The lower-earning 47% or workers, 72 million, whose mean average income is less than $10,000 also contribute $90,000 each. This does not seem fair or reasonable. Nor does it produce a society working at its full potential.
Is $22.81 an hour Ridiculous?
Raising the minimum wage to $22.81 on first blush seems overly generous, and outlandish. But in the light that each worker -- including all unemployed and part-timers and temp workers -- contributes $90,000 per year, then $41,000 for the lowest paid seems about right. Workers in a very wealthy society should not be living in poverty -- poverty is personally demeaning and has serious consequences to society at large. Our problem is political and managerial, not economic.
Unemployment Today
The unemployment rate today would be 11.4% (not today’s 6.6%) if the January 2007 employment to population ratio and unemployment rate were substituted for today’s lower ratio. And it would be 12.6% if the January 2000 ratios replaced today’s ratio. And 12.6% is a minor depression. Participation in the labor force has declined. The recession has driven workers out of the labor force. Those workers are not counted as unemployed. Employers have less demand for workers and pay raises are smaller. If we had the same ratios as January 2000, then an additional 14.3 million workers would be employed today, that is nearly an additional 10% to the number currently employed, 145 million. Instead we would have over 159.5 million employed. The present labor force is smaller than that, 155 million.
Income Share
In 1967 the lower-earning 90% of U.S. households received 66% of the nation’s income share, and in 2012 they received 50% while the top-earning 10% received 50%. A drop of 16% spread evenly over the 80% of the work force who are nonsupervisory workers means a loss of income in the range of $18,000 per worker. Labor’s share of income is at a historical low. (NYT Economix)

(StL Fed graph) A policy is needed to restore labor’s share; this will mitigate income inequality which is robbing the society and its economy of purchasing demand and vitality.
(StL Fed graph) A policy is needed to restore labor’s share; this will mitigate income inequality which is robbing the society and its economy of purchasing demand and vitality.

_______________________________________________
The Earned Income Tax Credit
President Obama has proposed to lift the minimum wage to $10.10 an hour. But to reach the equivalent of $22.81 an hour, the higher minimum wage should be matched with an increase in the Earned Income Tax Credit (EITC). The EITC is an annual wage bonus for low earning workers. A full-time year-round (FTYR) minimum wage worker at $10.10 an hour earns about $18,180. An additional $23,000 in annual income, using the EITC, would bring the FTYR worker's income to $41,000. In 2012 the EITC cost tax payers $60 billion dollars, it was distributed to 26 million workers, mostly to low-earning couples and single parents with children, at an average bonus of $2,300 per recipient. Increasing the EITC bonus by a factor of ten would increase the FTYR worker’s income by $23,000. Increasing the EITC tenfold would exact a cost of $600 billion per year. Presently the EITC increases the hourly income by $1.30 per hour. This proposal would increase it by almost $13 an hour. Mathematically, a $22.81 per hour minimum wage is also equal to a minimum wage of $10.10 for a full-time worker (annual income of $18,180) plus an EITC benefit that has increased by ten times from $2,300 per year to about $23,000. Total income $41,000. Here's an article that shows how the EITC works.
It could be done, but it would be a extremely messy, a political battle royal full sound and fury. It would throw society into unending turmoil. Perhaps perpetual growing poverty would be better? Why a tax on that recent wealth gain of $23 trillion? Didn't the collapse of the financial industry cause this mess, in part? Why not combine the EITC increase with Philip Harvey's plan for direct job creation, Back to Work? That would increase employment in itself, and the EITC would increase the wages paid across the spectrum.
It could be done, but it would be a extremely messy, a political battle royal full sound and fury. It would throw society into unending turmoil. Perhaps perpetual growing poverty would be better? Why a tax on that recent wealth gain of $23 trillion? Didn't the collapse of the financial industry cause this mess, in part? Why not combine the EITC increase with Philip Harvey's plan for direct job creation, Back to Work? That would increase employment in itself, and the EITC would increase the wages paid across the spectrum.

Progressive Change
Nonetheless, as U.C. professor Emmanuel Saez has stated, it's time to seriously propose a maximum income tax level of 80% on the highest earners. The Guardian article states, "For example,
doubling the average US individual income tax rate on the top
1% income earners from the current 22.5% level to 45%
would increase tax revenue by 2.7% of GDP per year – as
much as letting all of the Bush tax cuts expire (only a small
fraction of them lapsed in January 2013)."
And others have voiced appeals to create a financial transaction tax that would raise up to an additiional $700 billion, and the Congressional Progressive Caucus has proposed a direct public jobs program of $700 billion a year for three years to re-employ those who have been forced out of the labor market (see the Congressional Progressive Caucus). "The budget finances roughly $700 billion in job creation and public investment measures in 2013 alone and $2.1 trillion over 2013–2015.3 This fiscal expansion is consistent with Economic Policy Institute estimates of the fiscal support needed to rapidly restore the economy to full health (Bivens, Fieldhouse, and Shierholz 2013)."
Now that the President has gotten on board with a minimum wage increase, things are rolling; but a return to 1968 and an economy that grows wages in tandem with productivity is still very far away.
The Many Benefits
Such a change would increase the entire nation's economic output, and increase the number of working individuals at higher wages, and lead in time to a permanent reduction of dependency on government charity programs. Here is a report from the Institute of Policy Studies that concludes, "The annual economic benefits of returning income inequality to 1968 levels would be equivalent to adding a whopping 22 percent to Maryland's annual current Gross State Product." If the entire nation had this advance, the economy and all citizens would benefit. A 22% addition to economic output --- most of it would benefit lower-earning workers who earn less than the 6% of all personal income.
It would also improve family stability, the marriage rate, educational achievement, national security, and add a measure of security to the many, perhaps 3 out of 8 Americans, who live in families with less than $25,000 in savings. Presently our nation can boast of having an average household savings of $690,000 per household (according to the Federal Reserve Bank report). But the lower-saving households own only about 1.1% of all savings, about $11,000 per household. A survey from the FDIC, Department of Treasury, states that 44% of U.S. adults report they would be unable to pay an emergency $2,000 expense within a 30 day period, such is our liquid asset poverty rate. See article on liquid asset poverty here. "A family of four with less than $5,763 is liquid assets poor." "Nearly half (43.9%) of households do not have a basic personal safety net."
It would also improve family stability, the marriage rate, educational achievement, national security, and add a measure of security to the many, perhaps 3 out of 8 Americans, who live in families with less than $25,000 in savings. Presently our nation can boast of having an average household savings of $690,000 per household (according to the Federal Reserve Bank report). But the lower-saving households own only about 1.1% of all savings, about $11,000 per household. A survey from the FDIC, Department of Treasury, states that 44% of U.S. adults report they would be unable to pay an emergency $2,000 expense within a 30 day period, such is our liquid asset poverty rate. See article on liquid asset poverty here. "A family of four with less than $5,763 is liquid assets poor." "Nearly half (43.9%) of households do not have a basic personal safety net."
What is the Purpose of an Economy?
Such a wide discrepancy in household savings is a consequence of extremely low wages. It’s time to change that. Or is it better to have increasing poverty, instability, homelessness and dependency on a hand-out? We can create an economy that shares its growth and its rewards. The main question is: what is the goal and purpose of an economy? Is the purpose and over-riding goal of economic activity to provide the liberty for a small minority to have the freedom to accumulate and hoard an unlimited amount of capital for the pleasure of hoarding in their private accounts? Or is it to provide a method for all humans to exericise their talents and provide for themselves according to their innate skills and talents? It becomes a serious question of how damaging is the freedom for a few to accumulate unending stacks of bills that strain one’s mathematical imagination to the detriment of the vast majority who are either jobless or cannot find employment at a living wage. Like it or not, we have to care for every sentient being on the planet, especially those with human attributes. The minimum wage is a metric of civility and humanity.
New Civil Rights
In 1944 Franklin Roosevelt expressed the foundation of a civil society when in his proposal for a second bill of rights he stated as a right, “The right to a useful and remunerative job in the industries or shops or farms or mines of the nation; The right to earn enough to provide adequate food and clothing and recreation”. We are missing this right. About 10% of the nation’s workers cannot find any work, and another 40% cannot find sufficient work with adequate income. The solution is not just economic, it is moral, it is a historical promise and a destiny waiting to be fulfilled.

Here is a graph about wealth I used in my March 3, 2013 report.

Since 2008 the nation's private wealth has jumped up by $23 trillion, from $57 trillion to $80 trillion. Most of the gains went to owners of financial assets -- to the richest Americans. This graph does not capture the entire recent history up to today. But it shows the historical trend has not stopped.
Min. Wage Historical --- http://www.infoplease.com/ipa/A0774473.html
Inflation Calculator, bls -- http://data.bls.gov/cgi-bin/cpicalc.pl?cost1=1.60&year1=1968&year2=2012
GDP per person -- http://www.measuringworth.com/datasets/usgdp/result.php
http://www.stateofworkingamerica.org/fact-sheets/poverty/
2 comments:
It's actually worse!
Median wages have fallen 33% in the past 30 years, adjusted for inflation. Meanwhile the income of the top 1% has risen nearly 300%
Family income has been "flat" not because of wages rising with inflation but because more family members are forced to work: the flat family income is based on working more hours for the same pay.
In the 1st period, profits, productivity, and wages rose.
In the second period (with union movement crushed and taxes restructured to benefit the rich), profits and productivity rose while wages fell.
Shared prosperity vs theft.
Time to take it back.
The numbers and the fluctuations, the affected object and it is also very difficult and we should follow up.
Post a Comment