A Breakdown in Symbiosis

(For additional commentary by author and October 2014 Letters to the Editors, see here.)
Symbiosis is a mutually beneficial relationship. The symbiosis between households and corporations is now broken.
The Corporate economy is at war with the Household Economy; the corporations are winning, which means all of us are losing. Professor William Lazonick argues that they have become predators.

(from an Atlantic Monthly article, 2013)
Economic gains -- income and wealth -- accrue to the few as this graph shows

(graph from TooMuchonline.org, September 29, 2014)
Does this dynamic of a diminishing share of gains or growth going to the "bottom 99%" raise living standards or promote economic growth? It doesn't. The typical household earns only $200 more yearly than it did 24 years ago, 1989, a gain of less than 1%, while overall per capita "personal disposable income", a BEA figure, has risen by 45%, from $25,340 to $36,915 in "chained 2009 dollars".
I argue that the household income at the median could have also risen by 45% and be over $77,000 instead of today's $51,000.
By carefully shaping income distribution we not only grow the economy faster, we increase overall well-being faster. But "shaping" means creating a tight labor market with rising wages. Higher taxes on extremely high incomes, a financial transaction tax, the elimination of many wasteful tax expenditures that benefit the richest (read here and here and here and here -- you'll be an expert), and careful application of social policy to enable full employment, full labor negotiating rights, and an adequate social safety net (housing, medical, child care subsidies as well as income subsidies) all combine to create a renewed economy and society. See this September 2014 article about government transfers that reduce "market poverty" from 23% to 14.5% from Demos.org. -- and read my comment to it below. Or at the Center for Budget and Policy Priorities another article states, "Public programs lifted 40 million people out of poverty in 2011,"
reducing poverty by 12.8% of the population, reducing it from 29% to 16.1%.
Are corporations re-investing their profits productively back into the economy? The recent history of net fixed investment:

Another graph replicates the above one from the Atlantic Monthly article, with the title "Net Business Fixed Investments" at a CBO report, see page 36.
And this long-term look from an article at EconoMonitor:
This from an article in the NYTimes by Laura Tyson and Susan Lund. The authors state:
A look at the correlation between business investment and job growth, from the same Tyson and Lund article:

The left axis shows year-on-year change in real private investment in equipment and software; the right axis shows year-on-year change in private-sector employment. Sources: Bureau of Economic Analysis, Federal Reserve Bank of St. Louis, Bureau of Labor Statistics, McKinsey analysis
Low investment in equipment negatively impacts productivity growth, as Christian Weller reports from the Center for American Progress: "U.S. productivity rose 6.5 percent from June 2009 to June 2014, the first 20 quarters of the economic recovery since the end of the Great Recession. This compares to an average of 13.4 percent during all previous recoveries of at least equal length. No previous recovery had lower productivity growth than the current one."
What have corporations done with their record profits? Again, Christian Weller reports, September 2014, "From December 2007—when the Great Recession started—to June 2014, nonfinancial corporations spent, on average, 99.6 percent of their after-tax profits on dividend payouts and share repurchases."
This coincides with William Lazonick's report.
Professor Wm Lazonick at Huffington Post a few years ago wrote: "For 2001-2010, 459 companies in the S&P 500 Index in January 2011 distributed $1.9 trillion in dividends, equivalent to 40 percent of their combined net income, and $2.6 trillion in buybacks, equal to another 54 percent of their net income. After all that, what was left over for investments in innovation, including upgrading the capabilities of their workforces? Not much."
94% of profits over ten years going into non-productive purposes, not fixed investment. This is a disaster, the breakdown of an indispensable symbiosis. For a 50 page book excerpt, dated 2012, by Lazonick, see here. Or view his article in the September 2014 edition of the Harvard Business Review, here.
The article by Laura Tyson calls for $150 billion per year in federal government infrastructure spending.
"The last piece of the growth puzzle is infrastructure investment. The United States has been underinvesting in infrastructure for the last two decades, and the result is plain to see: congested roads, crumbling bridges and delays at airports. The cost of such underinvestment is more than just a test of endurance for commuters. Without modern infrastructure, products can’t move quickly and efficiently. Supply chains become more vulnerable, and businesses are more reluctant to invest."
14 Million New Jobs?
This $150 to $180 billion per year government infrastructure spending should be compared with the Progressive Caucus proposal to create public jobs on the order of $450 billion a year for three running years. Instead of creating 1.8 million new jobs, the Tyson/Lund approach, the Progressive Caucus would create 4.6 million. This may understate the true jobs creation numbers. Phillip Harvey makes a case (page 11) that a $46.4 billion expenditure would create 1 million government jobs plus an additional 414,000 indirect private sector jobs. Therefore enlarging that proposal by 10 times -- $450 billion per year -- would create in the neighborhood of 14 million new jobs, government and indirect private sector employment, at a net expense of $32,815 per job. This appears more inline with reasonable costs than the above (almost) $98,000 per jobs estimate cost from both the CPC and Tyson and Lund. Robert Pollin at PERI estimates a cost 42% higher than the Harvey estimate, see here, or $46,600 per job for 14 million jobs. Under Pollin the entire yearly cost would range around $630 billion, which I argue is possible with a financial transaction tax, tax expenditure reform, higher marginal income tax rates at the top, taxing capital gains at normal income tax rates, a set of higher corporate taxes, or a wealth tax or any combination of these options.
A new book, When Government Helped, explores the innovative programs of the 1930s New Deal with a dual purpose of providing pragmatic options for our recent Great Recession history.
Tyson recently wrote an article on the Highway Trust Fund, see here, and we learn that the gasoline tax has not been adjusted for inflation increase in 21 years, and "Investment in public infrastructure in the US has plunged to less than 2% of GDP, its lowest level since the federal government started tracking these data in 1992. The American Society of Civil Engineers (ASCE) gives a grade of D+ to infrastructure in the United States, reflecting both delayed maintenance and underinvestment." I think Tyson should have argued for a financial transaction tax to fund the investments she calls for. She limits her options, and implies their are no viable alternatives. See the CPEG report on a financial transaction tax, see here.
Here is a brief quote from the CPEG paper's concluding section:
"In sum, I have made the following arguments concerning an FTT. First, an FTT should be designed to apply to all classes or financial assets and to apply across the range of products traded in financial asset markets. Second, a financial transaction tax has the potential for raising a significant amount of revenue. Third, at current trading levels an FTT could generate as much as $1 trillion in revenue."
Below in this essay I have a section on wealth. I show how in six years private wealth has increased by 44% nominally and by 30.2% adjusted for inflation and population growth. Wealth has increased by $25 TRILLION since 2008.
Given the windfall of wealth over the past six years -- of which 75% went to the top-saving 5% of households, and that would be a savings gain of $2.6 million per household for 6 million households -- while the rest of the nation suffered -- a financial transaction tax is fair.
The top earning one percent increased their post-tax income (not wealth) share from 8% to 17% between 1979 and 2007, all at the expense of the lower-earning 80%, see CBO report. That is a $1.26 trillion increase every year to just 1.2 million very wealthy households, averaging over $1 million more each year of income.
Income Growth
While the wealthiest were drowning in unimaginable riches, the middle-earning quintile of households has gained 7% more income since 1979, 35 years ago (see here). The same reference shows the top 5% grew their income by 55%. Another report by the CBO (page 35) shows slightly different "market income" growth rates but the same pattern between 1979 and 2008: the middle income quintile grew by 14%, while the top 96 to 99th percentile grew by 63%, and the top 1% grew their income by 110% (see here, page 35). And the CBO's recent report on income distribution from 1979 to 2011 confirms, see page 18 and 9, that both the lower and the middle quintiles grew their pre-tax and pre-transfer "market income" by 16%, the lower from $6,810 to $7,900. And the middle quintile incomes grew by 16%, from $47,758 to $55,400, and the 81st to the 99th percentiles grew by 56%, from $118,381 to $184,675. The "market income" of the top 1% grew by 156%, from $565,429 to $1,447,500.
The Safety Net Expenses
Looking a little deeper, page 10, we see in the middle "all households" "Before-Tax Income (Dollars)" $93,900. That's the average income for all households, total income is over $11 trillion.
Also, we see that 4%of pre-tax income is applied to "Medicaid". 2%, and "other cash and in-kind" income, 2% -- a total of 4%, or around $450 billion. Or 4% of all income goes to the social safety net programs, exclusive of Social Security and Medicare which arguably are pension programs earned by the beneficiaries. This 4% would amount to $560 billion, or 4% of total $14 trillion private market income, as reported by the BEA (BEA.gov, personal income).
"The Myth of the Exploding Safety Net" challenges the view that we support the poor too lavishly. The CBPP report, "Low-Income Programs Are Not Driving the Nation's Long-Term Fiscal Problems", states:
In fiscal year 2012, total federal expenditures for low-
income entitlement (or mandatory) programs outside health care equaled 1.8 percent of GDP. This was about 40 percent higher than the average for the 40-year period 1973-2012, which was 1.3 percent of GDP. The costs of these programs have indeed risen significantly in the last few years. For low-income discretionary programs outside health care, total costs equaled 0.8 percent of GDP in 2012, about the same as the 40-year average for those programs. Together, mandatory and discretionary low-income expenditures outside health care totaled 2.6 percent of GDP in 2012, about 24 percent above the 40-year average of 2.1 percent.
And lastly, this Congressional Research Service report shows $733 billion expended to "Federal Benefits and Services Going to Low-Income People", and $733 billion was 4.5% of GDP in 2012. But 4% of total income is not equal to 4% of GDP. I think the Congressional Research report is more detailed and accurate on this issue.
Wealth Growth
In 25 years the wealth amount actually declined (see this recent Demos article, here), that states, "From 1989 to 2013, the mean wealth of the top 1% increased from $10.2 million to $18.8 million, an increase of 83%. By comparison, the overall median family wealth fell from $85.1 thousand to $81.2 thousand over the same period, a decline of 4.5%.".
From 1960 to 2000 corporate "fixed" investment averaged around 4% of GDP (equivalent to today's $680 billion), since 2000 it averages around 2%. In 1999 it held at about 5%, in 2010 it was around 0.9% -- a huge plunge.
Corporate Profits, at an all time high

Note again the growth figures of 8.2% and 64%, not between median household income and average "disposable income" per capita over a 30 year period, but in hourly worker compensation vs productivity.
What if?
What if median household income had grown at 64%? Then today's median household income would be ---
$77,376 instead of $51,107 -- 64% higher.
From EPI's book State of Working America:
From page 241, State of Working America, chapter on wages, between 1973 and 2011: "Had this rise in compensation inequality and fall in labor’s income share not occurred, the real hourly compensation of the median worker would have risen by 56.7 percent, 46 percentage points higher (65.9 percent of the 69.7 percentage-point gap between productivity and median compensation growth) than the actual 10.7 percent growth. That is a sizable loss for middle wage and other workers."
A median household income 46% higher than $51,939 (U.S. Census figure for 2013) would be $75,830 per year.
The graph above, "The Disconnect", is from a seminal paper from the EPI which states:
"This paper argues that broad-based wage growth is necessary to address a constellation of economic challenges the United States faces: boosting income growth for low- and moderate-income Americans, checking or reversing the rise of income inequality, enhancing social mobility, reducing poverty, and aiding asset-building and retirement security. The paper also points out that strong wage growth for the vast majority can boost macroeconomic growth and stability in the medium run by closing the chronic shortfall in aggregate demand (a problem sometimes referred to as “secular stagnation”). Finally, the paper argues that any analyses of the causes of rising inequality and wage stagnation must consider the role of changes in labor market policies and business practices, which are given far too little attention by researchers and policymakers."
WEALTH, again
Here's a nice graphic about wealth. From left to right,
bottom 40%, middle 20%, 4th 20%, then next 10%, next 5%, next 4%, final top 1%:

The graph does not concur with the facts cited by the source. Edward Wolff's paper of 2012, page 58, states that in 2010 the bottom 80% owned 11%,
the next 10% (80 to 90 percentile)owned 12.2%,
next 5% owned 13.6%,
the next 4% owned 27.7%,
the final 1% owned 35.4%. The graph does not look similar. The above chart must be showing the average savings per household in each group. That looks more accurate. Compare the amount above the 50th, 75th or 90th with that above the 100th.
Let's look at another wealth graph, from msnbc, same sort of thing but easier to visualize:

_____________________________________________
Private Wealth Grew by over 30% in last six years (adjusted per capita and for inflation), yet most households' incomes fell, millions lost their houses to foreclosure, bank sales, while also millions lost their employment and the employment to population ratio dropped to the level of 1983. This means that about 10 million workers who were working are now not even counted in the unemployment statistics. (see bls data here) And household median income dropped by 8% since 2007.
Private Net Worth Grew by $25 Trillion
This is a 30.2% growth (per capita and inflation adjusted) since 2008 according to the Federal Reserve. Have you noticed 30% more buildings, factories, homes or offices or cars or airplanes? In comparison, the total gross national debt is "only" $17 trillion, the annual GDP is also about $17 trillion, the Social Security Trust Fund is about $2.7 trillion, in comparison. $24.5 trillion -- it grew from $57 T to $82T in just six years. !! (See page 2 here.)
I wrote the Federal Reserve about this growth, and Bryan Noeth, a Fed economist, sent a table back showing that private net worth had gained, per capita and inflation adjusted, by 30.2% since 2008.
This growth reflects an assets bubble, an accumulation disease. The surplus -- call it profits, or excess income -- has no productive outlet. It just piles onto the valuation of stocks and paper assets, raising their prices without contributing to the economic efficiency or well-being of the society. Poverty actually increased during this period! If this $24.5T had been evenly distributed? Each household, each of 122 million households, would have increased their private savings by a $200,000, the median household would have increased savings by a factor of 3.6 times, almost quadrupling its savings.
But the majority, or 75%, of this gain of $25 T. in net assets went to the top-saving 5% who own 75% of all financial assets, therefore about $3 million per household went to all 6 million households in this top echelon. See Federal Reserve report here, page 2. The wealth share of the top 1% is now 40% of all wealth, greater than the combined lower-saving of 92% of households, see here at Demos.org. Is this a social disease that subtracts rather than adds to social well-being? that slows rather than speeds economic development?
Part of the justification for the Federal Reserve's program called QE 3 was that low interest rates would stimulate more loan creation for investment in fixed assets, resulting in more jobs. But with historically high profits, raising capital is not a concern for corporations.

There is a symbiotic relationship -- to restate my thesis -- between household economies and corporate economies, and that symbiosis is broken. I think corporate tax rules should penalize companies that do not re-invest profits, and if they maintain a severe salary ratio between executive and low-paid employees. The corporation is a fabulously productive invention, but it has to serve its purpose of enriching the workers and the nation. The top corporations ---- with 94% of profits to dividends and stock buy backs! -- obviously are serving ONLY themselves, and have been hijacked by a culture of greed.
Last, an example --- WalMart in 2013 I believe had $7.6 billion in profits to deal with, it chose to buy back stock, but it could have raised average annual wages to $25,000 for 825,000 employees, an hourly raise from about $9.06 an hour to $14.83, a 64% pay raise. (This is at Demos or at Mother Jones if you want to look for it.) WalMart didn't raise wages, the Walton's took it all for themselves.
Solutions:
I don't hear any politician talking about restructuring corporate taxes along democratic standards of high pay. Labor was 66% of total income, and now it's 58% according to Harold Meyerson writing at American Prospect and by the Federal Reserve graph shown above --- that 8% drop in total compensation is about $12,000 income loss per ALL lower-earning 80% of families. Add $12,000 to all the lowest 20% of households and poverty might be nearly eliminated.
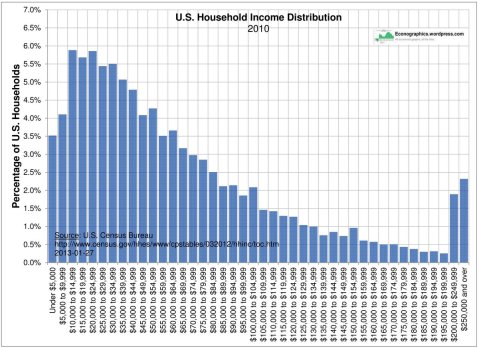
This US Census bar graph shows that 13.5% of households have total income of less than $15,000 per year. Most of them would be lifted out of poverty with an additional $12,000 of income.
The $12,000 per year income loss for all 80% of U.S. households is also mentioned in this CBO report, page xiii, that states:
"As a result of those changes, the share of household
income after transfers and federal taxes going to the
highest income quintile [or20% of households] grew from 43 percent in 1979 to 53 percent in 2007 (see Summary Figure 3). The share of after-tax household income for the 1 percent of the population with the highest income more than doubled,
climbing from nearly 8 percent in 1979 to 17 percent in
2007."
I'll restate that: if the 10% shift in post-tax and post-transfer income were restored to 1979 proportions, then $1.162 trillion in income would go to the lower-earning 80% of households (98 million households). Each household among the 80% would receive on average $12,000 more annual income, every year. And as I said, this would nearly eliminate poverty from the United States of America.
Fixing the corporate fixed investment story, and increasing wage income in the lower-earning 80% to distribution levels seen 30 to 40 years ago would benefit the entire population and the economy. My major gripes are with the medical sector, the financial sector, the military sector, and the political campaign corruption system. Furthermore we need to subsidize child care and institute mandatory paid vacation for all full-time workers. All this.
Again, Professor Wm. Lazonick at Huffington Post, explains how $4.5 trillion over ten years was basically wasted by U.S. corporations:
"For 2001-2010, 459 companies in the S&P 500 Index in January 2011 distributed $1.9 trillion in dividends, equivalent to 40 percent of their combined net income, and $2.6 trillion in buybacks, equal to another 54 percent of their net income. After all that, what was left over for investments in innovation, including upgrading the capabilities of their workforces? Not much."
Reforms and Solutions
You might like to read. click here Jeff Madrick's solution to the unemployment crisis, April 9, 2014, or click here for a direct view. This proposal includes these 15 steps:
CREATE MORE JOBS
1. Increase Fiscal Stimulus
2. Invest In Infrastructure
3. Fund Direct Employment
4. Counteract Short-term Wall Street Strategies
5. Regulate Private Equity
11. Increase Public Funding of Research and Development
12. Invest in Clean Energy
13. Revamp Workforce Training
14. Expand Programs Aimed at Opportunity Youth
(For additional commentary by author and October 2014 Letters to the Editors, see here.)
Symbiosis is a mutually beneficial relationship. The symbiosis between households and corporations is now broken.
The Corporate economy is at war with the Household Economy; the corporations are winning, which means all of us are losing. Professor William Lazonick argues that they have become predators.
(from an Atlantic Monthly article, 2013)
Economic gains -- income and wealth -- accrue to the few as this graph shows
(graph from TooMuchonline.org, September 29, 2014)
Does this dynamic of a diminishing share of gains or growth going to the "bottom 99%" raise living standards or promote economic growth? It doesn't. The typical household earns only $200 more yearly than it did 24 years ago, 1989, a gain of less than 1%, while overall per capita "personal disposable income", a BEA figure, has risen by 45%, from $25,340 to $36,915 in "chained 2009 dollars".
I argue that the household income at the median could have also risen by 45% and be over $77,000 instead of today's $51,000.
By carefully shaping income distribution we not only grow the economy faster, we increase overall well-being faster. But "shaping" means creating a tight labor market with rising wages. Higher taxes on extremely high incomes, a financial transaction tax, the elimination of many wasteful tax expenditures that benefit the richest (read here and here and here and here -- you'll be an expert), and careful application of social policy to enable full employment, full labor negotiating rights, and an adequate social safety net (housing, medical, child care subsidies as well as income subsidies) all combine to create a renewed economy and society. See this September 2014 article about government transfers that reduce "market poverty" from 23% to 14.5% from Demos.org. -- and read my comment to it below. Or at the Center for Budget and Policy Priorities another article states, "Public programs lifted 40 million people out of poverty in 2011,"
reducing poverty by 12.8% of the population, reducing it from 29% to 16.1%.
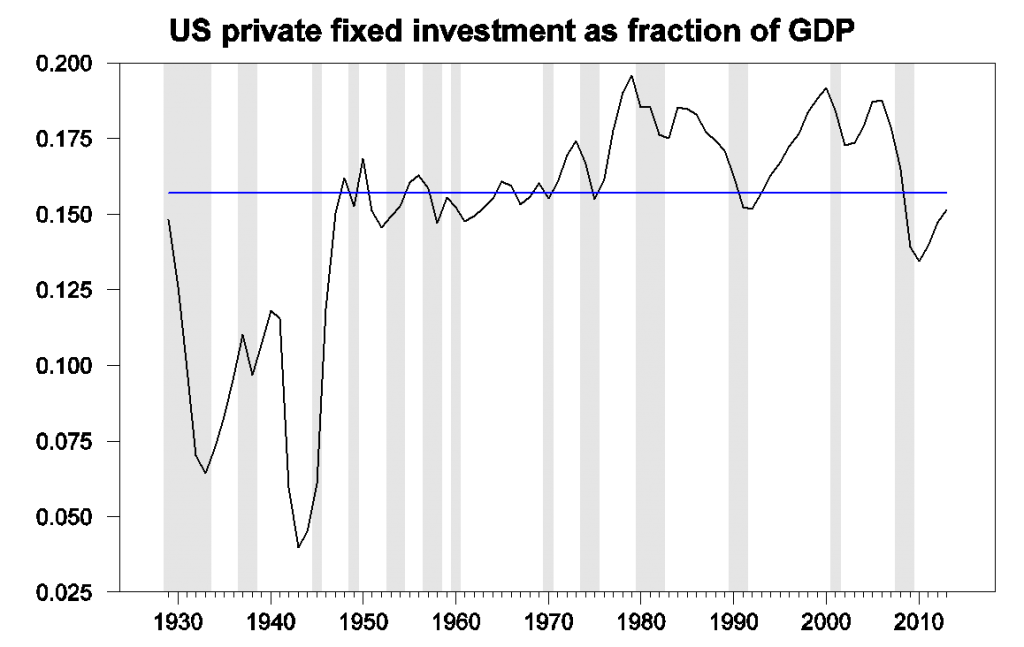
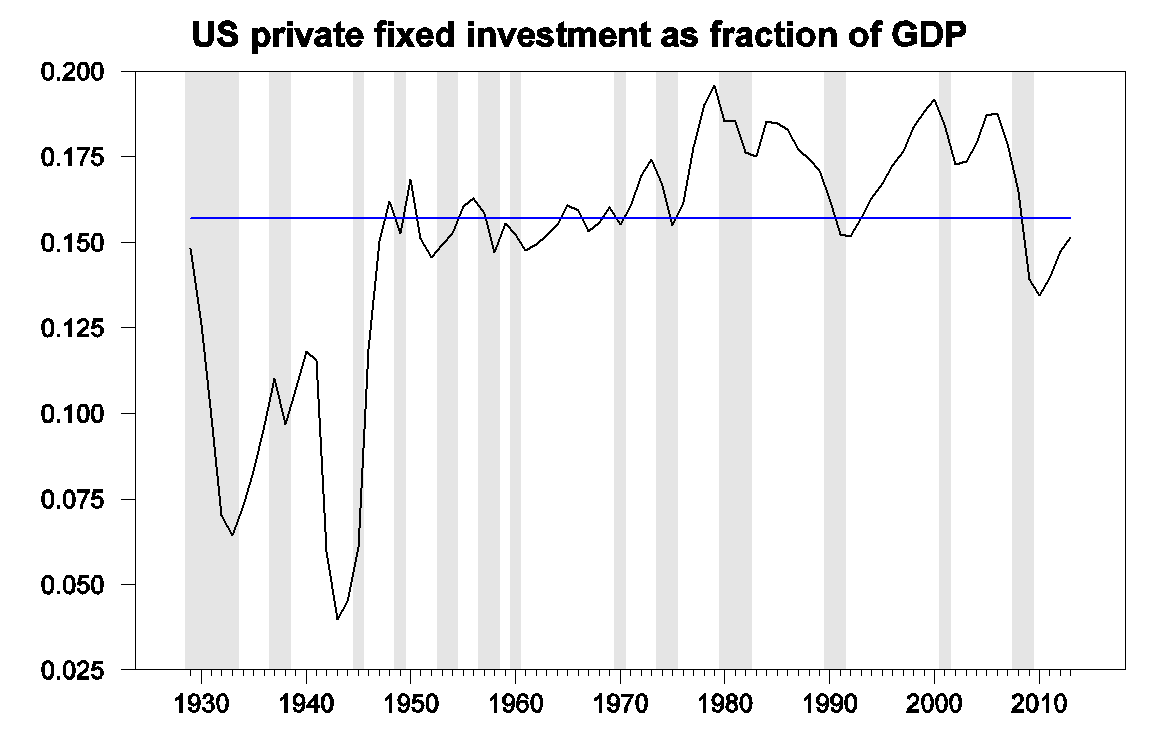
Are corporations re-investing their profits productively back into the economy? The recent history of net fixed investment:
Another graph replicates the above one from the Atlantic Monthly article, with the title "Net Business Fixed Investments" at a CBO report, see page 36.
And this long-term look from an article at EconoMonitor:
This from an article in the NYTimes by Laura Tyson and Susan Lund. The authors state:
When measured as a share of G.D.P., this trend is even more worrisome. Net productive investment averaged roughly 4 percent of G.D.P. in the United States in the postwar period until 2000. The share plummeted after the 2001 recession and again after the 2008-9 recession, falling to a historic low of just 0.63 percent of G.D.P. in 2009.
In 2012, after four years of [so called] recovery, the share was still below 2 percent of G.D.P., less than half of its 2000 peak of 4.7 percent.
(I add the [so called] because, in Heidi Sheirholz' words, as of July 3, 2014, "the unemployment rate would be 9.6 percent instead of 6.1 percent." I calculate that U3 unemployment would range between 9.0% to 10.4% depending on one's view of the effect of the Baby Boomer decline in labor market participation. But 9.6% is a RECESSION. A look at the correlation between business investment and job growth, from the same Tyson and Lund article:
Low investment in equipment negatively impacts productivity growth, as Christian Weller reports from the Center for American Progress: "U.S. productivity rose 6.5 percent from June 2009 to June 2014, the first 20 quarters of the economic recovery since the end of the Great Recession. This compares to an average of 13.4 percent during all previous recoveries of at least equal length. No previous recovery had lower productivity growth than the current one."
What have corporations done with their record profits? Again, Christian Weller reports, September 2014, "From December 2007—when the Great Recession started—to June 2014, nonfinancial corporations spent, on average, 99.6 percent of their after-tax profits on dividend payouts and share repurchases."
This coincides with William Lazonick's report.
Professor Wm Lazonick at Huffington Post a few years ago wrote: "For 2001-2010, 459 companies in the S&P 500 Index in January 2011 distributed $1.9 trillion in dividends, equivalent to 40 percent of their combined net income, and $2.6 trillion in buybacks, equal to another 54 percent of their net income. After all that, what was left over for investments in innovation, including upgrading the capabilities of their workforces? Not much."
94% of profits over ten years going into non-productive purposes, not fixed investment. This is a disaster, the breakdown of an indispensable symbiosis. For a 50 page book excerpt, dated 2012, by Lazonick, see here. Or view his article in the September 2014 edition of the Harvard Business Review, here.
The article by Laura Tyson calls for $150 billion per year in federal government infrastructure spending.
"The last piece of the growth puzzle is infrastructure investment. The United States has been underinvesting in infrastructure for the last two decades, and the result is plain to see: congested roads, crumbling bridges and delays at airports. The cost of such underinvestment is more than just a test of endurance for commuters. Without modern infrastructure, products can’t move quickly and efficiently. Supply chains become more vulnerable, and businesses are more reluctant to invest."
14 Million New Jobs?
This $150 to $180 billion per year government infrastructure spending should be compared with the Progressive Caucus proposal to create public jobs on the order of $450 billion a year for three running years. Instead of creating 1.8 million new jobs, the Tyson/Lund approach, the Progressive Caucus would create 4.6 million. This may understate the true jobs creation numbers. Phillip Harvey makes a case (page 11) that a $46.4 billion expenditure would create 1 million government jobs plus an additional 414,000 indirect private sector jobs. Therefore enlarging that proposal by 10 times -- $450 billion per year -- would create in the neighborhood of 14 million new jobs, government and indirect private sector employment, at a net expense of $32,815 per job. This appears more inline with reasonable costs than the above (almost) $98,000 per jobs estimate cost from both the CPC and Tyson and Lund. Robert Pollin at PERI estimates a cost 42% higher than the Harvey estimate, see here, or $46,600 per job for 14 million jobs. Under Pollin the entire yearly cost would range around $630 billion, which I argue is possible with a financial transaction tax, tax expenditure reform, higher marginal income tax rates at the top, taxing capital gains at normal income tax rates, a set of higher corporate taxes, or a wealth tax or any combination of these options.
A new book, When Government Helped, explores the innovative programs of the 1930s New Deal with a dual purpose of providing pragmatic options for our recent Great Recession history.
Tyson recently wrote an article on the Highway Trust Fund, see here, and we learn that the gasoline tax has not been adjusted for inflation increase in 21 years, and "Investment in public infrastructure in the US has plunged to less than 2% of GDP, its lowest level since the federal government started tracking these data in 1992. The American Society of Civil Engineers (ASCE) gives a grade of D+ to infrastructure in the United States, reflecting both delayed maintenance and underinvestment." I think Tyson should have argued for a financial transaction tax to fund the investments she calls for. She limits her options, and implies their are no viable alternatives. See the CPEG report on a financial transaction tax, see here.
Here is a brief quote from the CPEG paper's concluding section:
"In sum, I have made the following arguments concerning an FTT. First, an FTT should be designed to apply to all classes or financial assets and to apply across the range of products traded in financial asset markets. Second, a financial transaction tax has the potential for raising a significant amount of revenue. Third, at current trading levels an FTT could generate as much as $1 trillion in revenue."
Below in this essay I have a section on wealth. I show how in six years private wealth has increased by 44% nominally and by 30.2% adjusted for inflation and population growth. Wealth has increased by $25 TRILLION since 2008.
Given the windfall of wealth over the past six years -- of which 75% went to the top-saving 5% of households, and that would be a savings gain of $2.6 million per household for 6 million households -- while the rest of the nation suffered -- a financial transaction tax is fair.
The top earning one percent increased their post-tax income (not wealth) share from 8% to 17% between 1979 and 2007, all at the expense of the lower-earning 80%, see CBO report. That is a $1.26 trillion increase every year to just 1.2 million very wealthy households, averaging over $1 million more each year of income.
Or read Charles Morris' article that states, "The difference between the [top-earning] 1 percent’s income share in 1975 (8.9 percent) and today’s 22.5 percent is 13.6 percent. That additional share of personal income is worth $1.6 trillion. Each year.
What can you buy with $1.6 trillion? Well, it’s more than the annual outlays for Social Security payments, and about twice as large as Defense Department appropriations. It’s enough to pay off the federal debt held by the public in about seven years."
Income Growth
While the wealthiest were drowning in unimaginable riches, the middle-earning quintile of households has gained 7% more income since 1979, 35 years ago (see here). The same reference shows the top 5% grew their income by 55%. Another report by the CBO (page 35) shows slightly different "market income" growth rates but the same pattern between 1979 and 2008: the middle income quintile grew by 14%, while the top 96 to 99th percentile grew by 63%, and the top 1% grew their income by 110% (see here, page 35). And the CBO's recent report on income distribution from 1979 to 2011 confirms, see page 18 and 9, that both the lower and the middle quintiles grew their pre-tax and pre-transfer "market income" by 16%, the lower from $6,810 to $7,900. And the middle quintile incomes grew by 16%, from $47,758 to $55,400, and the 81st to the 99th percentiles grew by 56%, from $118,381 to $184,675. The "market income" of the top 1% grew by 156%, from $565,429 to $1,447,500.
The Safety Net Expenses
Looking a little deeper, page 10, we see in the middle "all households" "Before-Tax Income (Dollars)" $93,900. That's the average income for all households, total income is over $11 trillion.
Also, we see that 4%of pre-tax income is applied to "Medicaid". 2%, and "other cash and in-kind" income, 2% -- a total of 4%, or around $450 billion. Or 4% of all income goes to the social safety net programs, exclusive of Social Security and Medicare which arguably are pension programs earned by the beneficiaries. This 4% would amount to $560 billion, or 4% of total $14 trillion private market income, as reported by the BEA (BEA.gov, personal income).
"The Myth of the Exploding Safety Net" challenges the view that we support the poor too lavishly. The CBPP report, "Low-Income Programs Are Not Driving the Nation's Long-Term Fiscal Problems", states:
In fiscal year 2012, total federal expenditures for low-
income entitlement (or mandatory) programs outside health care equaled 1.8 percent of GDP. This was about 40 percent higher than the average for the 40-year period 1973-2012, which was 1.3 percent of GDP. The costs of these programs have indeed risen significantly in the last few years. For low-income discretionary programs outside health care, total costs equaled 0.8 percent of GDP in 2012, about the same as the 40-year average for those programs. Together, mandatory and discretionary low-income expenditures outside health care totaled 2.6 percent of GDP in 2012, about 24 percent above the 40-year average of 2.1 percent.
And lastly, this Congressional Research Service report shows $733 billion expended to "Federal Benefits and Services Going to Low-Income People", and $733 billion was 4.5% of GDP in 2012. But 4% of total income is not equal to 4% of GDP. I think the Congressional Research report is more detailed and accurate on this issue.
Wealth Growth
In 25 years the wealth amount actually declined (see this recent Demos article, here), that states, "From 1989 to 2013, the mean wealth of the top 1% increased from $10.2 million to $18.8 million, an increase of 83%. By comparison, the overall median family wealth fell from $85.1 thousand to $81.2 thousand over the same period, a decline of 4.5%.".
From 1960 to 2000 corporate "fixed" investment averaged around 4% of GDP (equivalent to today's $680 billion), since 2000 it averages around 2%. In 1999 it held at about 5%, in 2010 it was around 0.9% -- a huge plunge.
Corporate Profits, at an all time high
 Corporate profits are at a historical high as a portion of GDP (see this article with this graph).

I also checked the BEA.gov web page and made a graph of expanding corporate profits since 2000 to 2014 (Table 6.16D). Adjusted for inflation, profits jumped from $895 billion to $1,704 billion (or 10% of GDP), a 90% increase while the GDP/capita increased by 12% in 14 years, 2000 - 2014.
Corporate profits, up 90%
GDP per capita, up 12%
Median household income down 8.4% --- 2000 to 2013
Or a longer view from the Federal Reserve:


A summary graph (from this source):

And this last chart -- Return on Equity -- that will not reproduce here.
For a view of "Return on Equity" 2002 to 2014 click here.
--- it's a hidden graph at this blog page (won't copy over).
"Prior to 1994 there were only three years in the post Second World War period where the ratio of after tax profits even reached 16 percent for manufacturing companies . . ." -- from Samuel Rosenberg's American Economic Development Since 1945, page 298. From 2002 to 2013 ROE averaged around 19%.
Balancing Corporate Profits and Household Income --
A Key Concept
If you know only one thing about modern economies, with mass production, economies of scale, and mass consumption, it should be this idea: corporations and their consumers must balance, symbiotically, their share of economic surplus. When corporate profits remove most of the surplus from the economy, there are too few consumers, and the national economy must contract. If workers/consumers sop-up too much surplus in the form of household income, then corporations shrink, the economy contracts. An on-going balance is required. Jeff Madrick's book Why Economies Grow is the best exposition on this theme I know of. With inequality, consumer savings and credit eventually run dry and consumption stalls, a recession sets in. The one-sided surplus exhausts productive routes for re-investment, therefore stock asset prices soar to a point. And then, let's say, stock prices drop by 20% from their recent run-up; then consumption among the higher-income households will drop, and unemployment and hardship at the lower-earning level will increase. Is this common knowledge?
Where do people work?
A Snapshot of the U.S. Economy, 1984 to 2014

A summary graph (from this source):
Source: BEA.
And this last chart -- Return on Equity -- that will not reproduce here.
View Full Chart
Target Return on Equity (TTM) Chart
For advanced charting, view our full-featured Fundamental Chart
--- it's a hidden graph at this blog page (won't copy over).
"Prior to 1994 there were only three years in the post Second World War period where the ratio of after tax profits even reached 16 percent for manufacturing companies . . ." -- from Samuel Rosenberg's American Economic Development Since 1945, page 298. From 2002 to 2013 ROE averaged around 19%.
Balancing Corporate Profits and Household Income --
A Key Concept
If you know only one thing about modern economies, with mass production, economies of scale, and mass consumption, it should be this idea: corporations and their consumers must balance, symbiotically, their share of economic surplus. When corporate profits remove most of the surplus from the economy, there are too few consumers, and the national economy must contract. If workers/consumers sop-up too much surplus in the form of household income, then corporations shrink, the economy contracts. An on-going balance is required. Jeff Madrick's book Why Economies Grow is the best exposition on this theme I know of. With inequality, consumer savings and credit eventually run dry and consumption stalls, a recession sets in. The one-sided surplus exhausts productive routes for re-investment, therefore stock asset prices soar to a point. And then, let's say, stock prices drop by 20% from their recent run-up; then consumption among the higher-income households will drop, and unemployment and hardship at the lower-earning level will increase. Is this common knowledge?
Where do people work?
The US Census, in 2008, stated that half of "paid employees" (over 60 million workers) work in firms or "establishments" with more than 500 employees, and almost 66% work in firms with more than 100 employees, and about one sixth work in firms with less than 20 employees, out of 120.9 million total "paid employees". This data, in 2008, would cover 83% of everyone working in the U.S (see this BLS page).
____________________________________________
A Snapshot of the U.S. Economy, 1984 to 2014
Median household income ----------------------- up 8%
Typical worker compensation ------------------- up 8%
Productivity ---------------------------------------- up 64%
"Disposable personal income per capita in chained 2009 dollars" ----------------------------------------------------------------------- up 64%
Per capita GDP ------------------------------------ up 62%
"Real" inflation adjusted GDP ------------------- up 116%
Sources: median household income, page 33, "disposable personal income" Table 2.1, personal income, per capita GDP growth and "real" GDP growth at BEA.gov, and for productivity and worker compensation, read next paragraph.
And the well-known bifurcation of compensation vs. productivity is shown in this EPI graph: Just remember that productivity rose by 64%, compensation rose by 8%.
Disconnect between productivity and typical worker compensation,* 1948–2000 Note: From 1948 to 1979, productivity rose 108.1 percent, and hourly compensation increased 93.4 percent. From 1979 to 2013, productivity rose 64.9 percent, and hourly compensation rose 8.2 percent.
Note again the growth figures of 8.2% and 64%, not between median household income and average "disposable income" per capita over a 30 year period, but in hourly worker compensation vs productivity. What if?
What if median household income had grown at 64%? Then today's median household income would be ---
$77,376 instead of $51,107 -- 64% higher.
From EPI's book State of Working America:
From page 241, State of Working America, chapter on wages, between 1973 and 2011: "Had this rise in compensation inequality and fall in labor’s income share not occurred, the real hourly compensation of the median worker would have risen by 56.7 percent, 46 percentage points higher (65.9 percent of the 69.7 percentage-point gap between productivity and median compensation growth) than the actual 10.7 percent growth. That is a sizable loss for middle wage and other workers."
A median household income 46% higher than $51,939 (U.S. Census figure for 2013) would be $75,830 per year.
The graph above, "The Disconnect", is from a seminal paper from the EPI which states:
"This paper argues that broad-based wage growth is necessary to address a constellation of economic challenges the United States faces: boosting income growth for low- and moderate-income Americans, checking or reversing the rise of income inequality, enhancing social mobility, reducing poverty, and aiding asset-building and retirement security. The paper also points out that strong wage growth for the vast majority can boost macroeconomic growth and stability in the medium run by closing the chronic shortfall in aggregate demand (a problem sometimes referred to as “secular stagnation”). Finally, the paper argues that any analyses of the causes of rising inequality and wage stagnation must consider the role of changes in labor market policies and business practices, which are given far too little attention by researchers and policymakers."
WEALTH, again
Here's a nice graphic about wealth. From left to right,
bottom 40%, middle 20%, 4th 20%, then next 10%, next 5%, next 4%, final top 1%:
The graph does not concur with the facts cited by the source. Edward Wolff's paper of 2012, page 58, states that in 2010 the bottom 80% owned 11%,
the next 10% (80 to 90 percentile)owned 12.2%,
next 5% owned 13.6%,
the next 4% owned 27.7%,
the final 1% owned 35.4%. The graph does not look similar. The above chart must be showing the average savings per household in each group. That looks more accurate. Compare the amount above the 50th, 75th or 90th with that above the 100th.
Let's look at another wealth graph, from msnbc, same sort of thing but easier to visualize:
_____________________________________________
Private Wealth Grew by over 30% in last six years (adjusted per capita and for inflation), yet most households' incomes fell, millions lost their houses to foreclosure, bank sales, while also millions lost their employment and the employment to population ratio dropped to the level of 1983. This means that about 10 million workers who were working are now not even counted in the unemployment statistics. (see bls data here) And household median income dropped by 8% since 2007.
Private Net Worth Grew by $25 Trillion
This is a 30.2% growth (per capita and inflation adjusted) since 2008 according to the Federal Reserve. Have you noticed 30% more buildings, factories, homes or offices or cars or airplanes? In comparison, the total gross national debt is "only" $17 trillion, the annual GDP is also about $17 trillion, the Social Security Trust Fund is about $2.7 trillion, in comparison. $24.5 trillion -- it grew from $57 T to $82T in just six years. !! (See page 2 here.)
I wrote the Federal Reserve about this growth, and Bryan Noeth, a Fed economist, sent a table back showing that private net worth had gained, per capita and inflation adjusted, by 30.2% since 2008.
This growth reflects an assets bubble, an accumulation disease. The surplus -- call it profits, or excess income -- has no productive outlet. It just piles onto the valuation of stocks and paper assets, raising their prices without contributing to the economic efficiency or well-being of the society. Poverty actually increased during this period! If this $24.5T had been evenly distributed? Each household, each of 122 million households, would have increased their private savings by a $200,000, the median household would have increased savings by a factor of 3.6 times, almost quadrupling its savings.
But the majority, or 75%, of this gain of $25 T. in net assets went to the top-saving 5% who own 75% of all financial assets, therefore about $3 million per household went to all 6 million households in this top echelon. See Federal Reserve report here, page 2. The wealth share of the top 1% is now 40% of all wealth, greater than the combined lower-saving of 92% of households, see here at Demos.org. Is this a social disease that subtracts rather than adds to social well-being? that slows rather than speeds economic development?
Part of the justification for the Federal Reserve's program called QE 3 was that low interest rates would stimulate more loan creation for investment in fixed assets, resulting in more jobs. But with historically high profits, raising capital is not a concern for corporations.
There is a symbiotic relationship -- to restate my thesis -- between household economies and corporate economies, and that symbiosis is broken. I think corporate tax rules should penalize companies that do not re-invest profits, and if they maintain a severe salary ratio between executive and low-paid employees. The corporation is a fabulously productive invention, but it has to serve its purpose of enriching the workers and the nation. The top corporations ---- with 94% of profits to dividends and stock buy backs! -- obviously are serving ONLY themselves, and have been hijacked by a culture of greed.
Last, an example --- WalMart in 2013 I believe had $7.6 billion in profits to deal with, it chose to buy back stock, but it could have raised average annual wages to $25,000 for 825,000 employees, an hourly raise from about $9.06 an hour to $14.83, a 64% pay raise. (This is at Demos or at Mother Jones if you want to look for it.) WalMart didn't raise wages, the Walton's took it all for themselves.
Solutions:
I don't hear any politician talking about restructuring corporate taxes along democratic standards of high pay. Labor was 66% of total income, and now it's 58% according to Harold Meyerson writing at American Prospect and by the Federal Reserve graph shown above --- that 8% drop in total compensation is about $12,000 income loss per ALL lower-earning 80% of families. Add $12,000 to all the lowest 20% of households and poverty might be nearly eliminated.
This US Census bar graph shows that 13.5% of households have total income of less than $15,000 per year. Most of them would be lifted out of poverty with an additional $12,000 of income.

The $12,000 per year income loss for all 80% of U.S. households is also mentioned in this CBO report, page xiii, that states:
"As a result of those changes, the share of household
income after transfers and federal taxes going to the
highest income quintile [or20% of households] grew from 43 percent in 1979 to 53 percent in 2007 (see Summary Figure 3). The share of after-tax household income for the 1 percent of the population with the highest income more than doubled,
climbing from nearly 8 percent in 1979 to 17 percent in
2007."
I'll restate that: if the 10% shift in post-tax and post-transfer income were restored to 1979 proportions, then $1.162 trillion in income would go to the lower-earning 80% of households (98 million households). Each household among the 80% would receive on average $12,000 more annual income, every year. And as I said, this would nearly eliminate poverty from the United States of America.
Fixing the corporate fixed investment story, and increasing wage income in the lower-earning 80% to distribution levels seen 30 to 40 years ago would benefit the entire population and the economy. My major gripes are with the medical sector, the financial sector, the military sector, and the political campaign corruption system. Furthermore we need to subsidize child care and institute mandatory paid vacation for all full-time workers. All this.
Again, Professor Wm. Lazonick at Huffington Post, explains how $4.5 trillion over ten years was basically wasted by U.S. corporations:
"For 2001-2010, 459 companies in the S&P 500 Index in January 2011 distributed $1.9 trillion in dividends, equivalent to 40 percent of their combined net income, and $2.6 trillion in buybacks, equal to another 54 percent of their net income. After all that, what was left over for investments in innovation, including upgrading the capabilities of their workforces? Not much."
Reforms and Solutions
You might like to read. click here Jeff Madrick's solution to the unemployment crisis, April 9, 2014, or click here for a direct view. This proposal includes these 15 steps:
CREATE MORE JOBS
1. Increase Fiscal Stimulus
2. Invest In Infrastructure
3. Fund Direct Employment
4. Counteract Short-term Wall Street Strategies
5. Regulate Private Equity
CREATE BETTER JOBS
6. Raise the Minimum Wage
7. Expand the Earned Income Tax Credit
8. Institute National Paid Sick & Family Leave
9. Protect the Right to Organize
10. Enforce Labor Laws
CREATE FUTURE JOBS11. Increase Public Funding of Research and Development
12. Invest in Clean Energy
13. Revamp Workforce Training
14. Expand Programs Aimed at Opportunity Youth
15. Reduce Child Poverty
The Chicago Political Economy Group, CPEG, published recently an article about their Financial Transaction Tax, the one that could raise $1 trillion per year to finance a national living wage jobs for all program. Read the article here.
Excerpt:
I think it is essential that we find ways of making these statistics real to the people we talk to. Here is one way I try to do it. Imagine we could take all the officially unemployed and underemployed and line them up, shoulder to shoulder. The line would stretch from San Diego to Bangor, Maine, and back again – and there would still be about 2 million people trying to get into the line. That is a national disgrace – and a huge collection of personal tragedies.
Also needed:
Corporate tax reform to encourage investment and discourage stock buy backs and excessive dividends.
Tax capital gains at standard income level tax rates to save $88 billion per year.
Eliminate tax deductions to corporations worth $77 billion a year on interest payments. (for last two suggestions, see Representative Jan Schakowsky's budget plan to reduce the deficit.)
Raise the top marginal income tax rate on income over $1 million. From 1932 to 1980 the top income tax bracket was 81% on average (a fact I found in a review of Picketty's book Capital).
Or the reader may like to read a comprehensive reform program, The Way Forward, (by Nouriel Roubini, Dan Alpert and Robert Hockett) which still today contains the requisite steps for restoring economic health. This plan has three pillars: 1, A Federal Jobs Program, 2, Debt Restructuring of both mortgage loans and technically defunct banks, 3, Establish Foreign Trade Balance. Combine these programs with a financial transaction tax and a tax on wealth in excess of $50 million -- and many of OUR societal ills would find a remedy. (And remember to read other recent essays I posted at this blog.)
As though this blog entry were not complex enough, I'm adding some reading suggestions for myself. First, an article by Lazonick at the Harvard Review of Business, September 2014.
Then a recent article at the Next New Deal referencing a "white paper" by Joseph Stiglitz about tax reform (and see here).