A Radical Populist Budget
This budget increases total U.S. government revenue and spending to the level of the German government, equal to 43% of GDP, up from 37%. This increase of 6% equals about $1.2 trillion. In the U.S. we spend about 8% of GDP on social benefit programs, in Germany those programs consume 19%, in France 24%. The quality of living for the majority of French and German citizens is higher than the U.S., even though their per adult production is smaller. This budget will raise U.S. living standards. The burden of the tax increases fall on the top-earning 1% who earned 21.7% of the annual national income, and paid 23.8% of all taxes. They also own about 40% of all assets, have seen their net worth double in the past 9 years, and enjoy a net worth on average of about $30 million, plus their incomes have tripled, from $420,000 to $1.3 million per adult over the last 34 years. In the same period the lower-half of U.S. adults have seen a 1% increase in income, from $16,000 to $16,200 per adult, with a slight decline in net worth.
The Trump budget, and the Ryan-Republican budgets in years before, are all terrible ideas. Read my critique at the end of this article. But See this series of graphs for an overview of the damage.
(A very quick idea of this Radical Budget plan can be captured by looking at the 17 steps found by scrolling down to the tax table below. Or begin where it says Summary. At the end of the essay I include two "letters to the editor" critical of the Trump/Republican Budget.)
Here are the 17 steps that raise tax revenue, cut deductions, eliminate programs, and add programs:
Tax Increases
1. Higher income taxes on the top-earning 1% -- $540 billion.
2. A Wealth Tax -- $186 billion.
3. Taxing Capital Gains and Dividends at the standard personal rate --------- $88 billion.
4. A Financial Transaction Tax -- $250 billion.
5. Estate Tax reform -- $45 billion.
6. A Minimum Income Tax on corporate Earnings -- $35 billion.
7. Corporate Foreign Income Tax -- $150 billion.
8. Additional Funding to the IRS -- $20 billion.
9. A Tax on Carbon -- $32 billion.
10. Social Security Tax Increase -- $50 billion (not included in the
total tax increase sum).
11. Medicare for All funded by payroll taxes and other means (again not included in the total tax increase sum)
Eliminating or Reducing Deductions:
12. Corporate Interest Expense Deduction -- $77 billion.
13. Capping total deductions on personal income
at 28% -- $64 billion.
14. Executive Pay, etc. -- $46 billion.
Reductions in Outlays:
15. Reducing Military Expenditures -- $111 billion.
Additional Outlays for Social Benefit:
16. Earned Income Tax Credit increase -- $140 billion.
17. Public Jobs-Creation Program -- $200 billion.
_________________________________________________
A report (and a shorter article) from the Washington Center on Equitable Growth shows that between 1980 and 2014 the wealthiest 1% increased their yearly incomes by 200%, a tripling of income, from $420,000 to $1.3 million per adult. In the same period the lower-earning half of U.S. adults saw their incomes creep upwards by 1%, from $16,000 to $16,200. There has never been a worse time to give away massive tax cuts to the wealthiest. And with at least 30% of the population living in precarious economic conditions, it’s not a time to cut their support.
This Radical Populist Budget (RPB) radically shifts the tax burden to the richest; it helps the poor, the middle-income, and the upper income households -- but not the ultra rich. The process is six-fold:
1) Raise revenues by taxing the income and wealth of the top 1%,
2) eliminate unneeded deductions,
3) cut certain unwanted programs such as excessive military spending, and
4) increase spending that has a high social payoff, such as enlarging the Earned Income Tax Credit (EITC) and creating a public jobs program. (Recently even the former Secretary of the Treasury, Robert Rubin proposed this program.)
5) fund Medicare for All and an increase in Social Security.
6) Lastly, step six, provide a large tax reduction to households whose incomes fall between $50,000 and $150,000 a year. That’s a progressive budget.
We already have a progressive budget, it’s called the People’s Budget, promoted by the Congressional Progressive Caucus, and it's well worth examining. But my plan goes beyond the CPC budget and points towards a more progressive agenda. My two main sources for this rumination are 1) the budget put forward by Representative Jan Schakowsky in 2011; and 2) two articles (here and here) by Jared Bernstein, who was chief economic advisor to former Vice President Biden. And I’ve added some support from the Bernie Sanders’ platform, from the Chicago Political Economy Group (CPEG), from the Political Economy Research Institute (PERI), and from the Institute on Tax and Economic Policy (ITEP), and other sources.
Summary
I call this budget the Radical Populist Budget (RPB), and it raises $1.644 trillion in new revenue and re-allocated spending --- $1,346 billion in new taxes, $187 billion by eliminating loophole deductions, and $111 billion by reducing military spending — for a total of $1.644 trillion. It increases the federal on-budget budget by 32% (the off-budget portion of the budget deals with only Social Security). This year's budget taxed 85%, borrowed 15%, and spent 100%. The RPB would tax 132% and spend 132%. The budget pays off the deficit and adds more revenue for programs that have high social value, and adds enough for tax cuts to some middle to high incomes. It helps at least 90% of the population.
The current 2017 U.S. budget raised $2,911 billion in “on-budget” revenue, spent $3,364 billion, and was in in deficit by $453 billion (see Tables 1 and 2). It taxed 85%, borrowed 15%, and spent 100%. The RPB revenues adds $1.6 trillion to the already $2.9 trillion in revenues, for a total of 4.5 trillion. This increases federal spending to almost 27% of GDP, which is high. Additional expenditures I envisage include a $200 billion jobs creation program (for infrastructure improvement and human services provision) and a doubling of the Earned Income Tax Credit, an increase from $70 billion to $140 billion (see the plan by Senator Sherrod Brown and Representative Khanna).
The current 2017 U.S. budget raised $2,911 billion in “on-budget” revenue, spent $3,364 billion, and was in in deficit by $453 billion (see Tables 1 and 2). It taxed 85%, borrowed 15%, and spent 100%. The RPB revenues adds $1.6 trillion to the already $2.9 trillion in revenues, for a total of 4.5 trillion. This increases federal spending to almost 27% of GDP, which is high. Additional expenditures I envisage include a $200 billion jobs creation program (for infrastructure improvement and human services provision) and a doubling of the Earned Income Tax Credit, an increase from $70 billion to $140 billion (see the plan by Senator Sherrod Brown and Representative Khanna).
Medicare for All
The proposal to create a single-payer Medicare for All program is not included in the RPB. Information for the budgeting effects of this proposal can be found at Dollars and Sense magazine. (A longer version of this article appeared at The Conversation. And the author's calculations appear at Dollars and Sense.)
Social Security Nor does the RPB include benefit increases to Social Security (S.S.) recipients, as these are called “off-budget” expenditures, which is a nomenclature for the self-funded Social Security program. A proposal to increase S.S. benefits can be found at the Bernie Sanders’ site. Basically he calls for an increase of 5% in Social Security benefits, about $50 billion, funded by increasing the S.S. payroll tax on wage earnings above $250,000.
Social Security Nor does the RPB include benefit increases to Social Security (S.S.) recipients, as these are called “off-budget” expenditures, which is a nomenclature for the self-funded Social Security program. A proposal to increase S.S. benefits can be found at the Bernie Sanders’ site. Basically he calls for an increase of 5% in Social Security benefits, about $50 billion, funded by increasing the S.S. payroll tax on wage earnings above $250,000.
Presently there is nothing similar to the RPB budget, it’s purely an imaginative exercise. But it is important to look forward, to dream. My main complaint about our economy is the utter waste of our surplus. The surplus or "economic growth" benefits only a small fraction of Americans and most of it is never used productively, which I explain below. The public federal debt is 14% of total private net worth, the budget is just 4% of net worth, and this past year’s deficit was 0.5%. If I had $1,000 in the bank, the debt would amount to $140, the annual budget $40, and the deficit $5.
An Overview of the Macro Problem
The nation has private net worth of $96.2 trillion, and only a third of it is taxed. (See Flow of Funds report, page 2 and 138) The only asset we tax is “tangible property” such as homes and real estate, while the total value of financial assets, more than double that of “tangible property”, goes untaxed. The idea of taxing financial assets is off the table. “State and local governments collected a combined $488 billion in revenue from property taxes, or 17 percent of general revenue in 2015.” states the Tax Policy Center. A commensurate tax on financial assets would yield $1.1 trillion, equal to 39% of all “on-budget” revenue. The budget I propose taxes financial assets lightly, just $186 billion.
Rana Foroohar, former economics editor for Time magazine, in her book Makers and Takers, cites evidence that 15% “of all financial flows now go into projects in the real economy. The rest [85%] simply stays inside the financial system, enriching financiers, corporate titans, and the wealthiest fraction of the population . . .” (page 7, and she cites Adair Turner's book Between Debt and the Devil, and this NBER report) Since January 2009, when the total private "household net worth" stood at $48.8 trillion, net worth has doubled to its present size, $96.2 trillion. How much of this new wealth has gone into the actual work-a-day world of the productive economy? An enormous stock bubble effected this explosive gain in financial values, now at $78 trillion. (See Federal Reserve, Flow of Funds, Table B.101, page 138)
*_____*_____*_____*______*_____*______*______*_________
This article, "Why Stopping Tax Reform Won't Stop Inequality", by Lance Taylor at INET explains in detail the mess we've got ourselves into. He states,
"Figure 1 shows clearly it took 30 or 40 years for the present distributional mess to emerge. It may well take a similar span of time to clean it up. Progressive tax changes of $100 billion here or $50 billion there are not going to impact overall inequality. The same is true of once-off interventions such as raising the minimum wage by a few dollars per hour."
In the same vein, this article, "Inequality Is Slowing U.S. Economic Growth", by Josh Bivens at EPI.org makes this case:
" In the longer run, we need to stop or reverse rising inequality by enacting policies that spur faster wage growth for low- and middle-wage workers. Raising these workers’ wages would not only raise living standards for American families, it would also ensure robust economic growth."
*______*_______*_______*______*______*______*_______*
To continue ---
This inefficient misuse of the surplus begins with corporate profits. William Lazonick documented the disposal of corporate profits in an award winning article at the Harvard Business Review, “Profits without Prosperity”. Some 91% of profits over a 10 year span of the 500 largest companies in America went to either stock buybacks or dividends to shareholders, and that left little for wage increases or research expenses. It's interesting to note the progress of U.S. household net worth (see page 104). In 2006 it hit a high of $64.520 trillion, only to fall in 3 years to $48.475 trillion in Q1 of 2009, a drop of $16.0 trillion, or a drop of 25%. In 2017, Q2 it stands at $96.2 trillion. (see here, page 2 and 144). This almost doubles net worth in almost 9 years, from $48 trillion to $96 trillion. How, one should ask, is it possible to double the nation's private net worth in the middle of the agonizingly slow recovery, millions of home foreclosures, a plunge in employment rate, and the economic performance well below potential? How does private net worth surge in the environment of high government debt and deleveraging financial debt? Is it extraordinary savings? What could cause this explosion? The savings rate in the 9 years averaged 5.6% (see BEA.gov, Table 2.1). The annual national income averaged at $14.3 trillion over 9 years. The total savings amount sums to $7.2 trillion. The net worth grew by $47 trillion. Where did the other $40 trillion come from? Corporate buybacks added about $4 trillion (see here, graph 11), but the rest?
This is, by the way, real money, not just marks on paper. It can be cashed-out to buy food, houses, time with your attorney or surgeon, railroads, other corporations, etc.. The total 9 year's worth of income amounted to $129 trillion, so the $47 trillion in new net worth is more than a third of the total income over 9 years. It's almost double the total expenditures of the federal government in these 9 years. It's almost 5 times the growth of the national debt. These are assets that have no productive or constructive purpose. They flowed into a financial bubble. They are hoarded. If they were squandered, then at least there would be a secondary effect in added employment and income to some workers who would be employed shining the chrome on limousines.
The article mentioned above from the WCEG states, "From 1980 to 2014, for example, none of the growth in per-adult national income went to the bottom 50 percent, while 32 percent went to the middle class (defined as adults between the median and the 90th percentile), 68 percent to the top 10 percent, and 36 percent to the top 1 percent. An economy that fails to deliver growth for half of its people for an entire generation is bound to generate discontent with the status quo and a rejection of establishment politics." To restate, 32% of growth went to percentiles 50 to 90, 32% went to percentiles 91 to 99, and 36% went to the top 1%. And much of the growth, since 2009, went into the financial markets, is my guess.
When most of the economy's surplus resides in financial assets the result is elephantiasis of the financial system, distorting and injuring growth and prosperity. Thomas Palley, senior economic policy advisor for the AFL-CIo, wrote a chapter in the book Restoring Shared Prosperity, "Making Finance Serve the Real Economy", (on page 73) that clearly outlines the destruction of shared prosperity. It traces the policies that severed "the link between wages and productivity growth." This chapter is a profound condensation of the breakdown since 1980, a "do not miss" explanation; readers who sense a frustration in their understanding of the network of linkages that created a world of hurt, of malfunctioning economic dynamics will see the clarity of the causes and effects.
To sum up, we squander our surplus. If all these assets were boxed and sunk into the Mariana Trench, we'd would be better off. See the article from the New York Times. This chart marks the percentiles that received income growth, 1980 is grey, 2014 is red.

*** **** **** **** **** **** **** **** *** ** *
The Radical Populist Budget, the details:
I break down my budget policy into five categories: Tax Increases, Tax Deduction Eliminations, Spending Cuts to Existing Programs, Additional Program Expenses, and Tax Cuts.
The table from the Institution on Taxation and Economic Policy (ITEP) shows the “overall effective” tax rates for different income levels. The word “overall” means a combination of local, state and federal taxes, and “effective” means taxes as a percentage of total personal income.
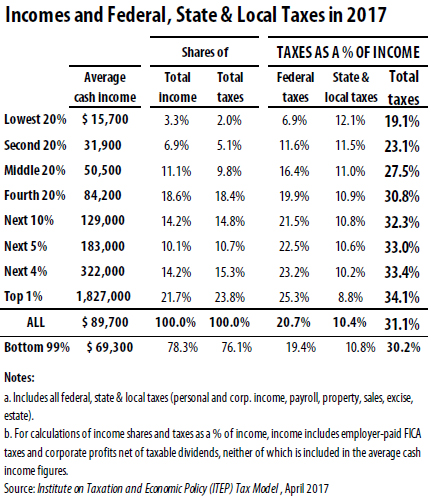
The top-earning one percent of all households earns 21.7% of all income and pays 23.8% of all taxes, and that includes not only federal but state and local taxes too. The lower-earning 90% earn 54% of all income and pay 50% of all taxes. This is barely progressive taxation, not to mention the bizarre imbalance in income distribution. The budget proposed by Representative Paul Ryan in 2016 would have reduced the share of taxes paid by the top one percent from 23.8% to 21.0%, meaning an income of $129,000 would have paid a higher tax rate to all government than an income of $1,800,000, states the document from ITEP.
#1 — Raise the Personal Income Tax Rate on High Earners.
I propose to increase their overall effective rate for the 1 percent, from 34.1%, to about 50%. That would indicate an increase of revenues by (15.9% times 21.7%) 3.4% of all national income, a revenue increase of between $540 billion and $560 billion. During the 1950s the highest overall effective rate for federal taxes is estimated at between 40% and 45% during the decades of the 1950s (See Piketty, Saez, Zucman, page 29). The addition of state and local taxes on the 1% would lift that rate to over 50%. So this level of high taxation is not a historically high rate. The deficit for 2017 was $453 billion, so this one measure eliminates the deficit.
We might call it a day, after that tax shift. But we are only beginning.
#2 — A Wealth Tax
The total net worth of all households on September, 2017, stands at $96.2 trillion (Federal Reserve, Flow of Funds, page 2, and Table 101.B). That comes to an average net worth per adult, age 20 and older, of about $400,000 — an indication of how wealthy the U.S. actually is. The top one percent own 38.5% of all net worth, or $37 trillion. I propose a tax rate of 0.5%, which in 2017 yields $186 billion. As I mentioned earlier, a financial tax commensurate with the property tax on tangible assets would yield $1.1 trillion. Only this last month France had a tax of 1.5% on high wealth (see here). James Kwak also has proposed “A Retrospective Tax on Wealth” that would “replace most existing taxes on capital (the estate tax, the corporate income tax, and most individual taxes on investment income) while maintaining the current overall tax burden.”
#3 — Taxing Capital Gains and Dividends at the Standard Personal Income Rate
This was proposed by Representative Jan Schakowsky in 2011, and she indicates it would raise $88 billion. And the ITEP estimate is $84 billion per year.
#4 — A Financial Transaction Tax (FTT) would raise $250 billion, says the PERI institute. A more recent study from PERI places the revenue stream at $220 billion. The Chicago Political Economic Group estimates a much greater revenue stream.
#5 — Estate Tax reform, according to Jared Bernstein’s report, would raise $45 billion.
#6 — A Minimum Income Tax on Corporate Earnings, an effective rate of 19% would raise about $35 billion, states Bernstien.
#7 — A Corporate Foreign Income Tax and Other Business Tax Reforms would raise $150 billion according to the Institute on Taxation and Economic Policy (ITEP). The ITEP has many studies on corporate taxation, see this one. The ITEP also recommends (and see here) that corporations pay immediately their $767 billion arrears in unpaid foreign taxes.
#8 — Additional Funding for the IRS to catch tax dodgers would raise $20 billion a year.
#9 — A Tax on Carbon, says Jared Bernstein, would raise $32 billion.
#10 — Social Security Tax Increase on High Earners, according to Bernie Sanders’ program, would yield $50 billion. But since Social Security is “off-budget”, I do not include that proposal in this set of tax increases.
#11 -- Medicare for All is explained by the article at Dollars and Sense by Gerald Friedman. And recently the American Prospect with the Century Foundation has published six articles on the topic.
The total increase in revenues, not including #10, from these nine changes yields $1,346 billion.
________________________________________________________
Tax Deduction Eliminations:
#1 — Corporate Interest Expense Deduction. Jan Schakowsky’s budget projects an increase of $77 billion due to the elimination of this deduction.
#2 — Capping total deductions on personal income at 28% (or possible even lower, perhaps even 15%) would yield $64 billion, states Jared Bernstein.
#3 — Executive Pay, Environmental Rentals, Farm Subsidies, Real Estate — combined, the Schakowsky budget projects an increase of $46 billion through the elimination of these deductions.
___________________________________________________________
Current Program Reduction in Outlays
#1 — Reducing the Military Budget by $111 billion. Schakowsky’s plan would release and transfer revenue, making it available for other existing government programs.
___________________________________________________________
Outlay Increases
#1 — Increase the Earned Income Tax Credit from $70 billion to $140 billion per year is the proposal from Senator Sherrod Brown and Representative Khanna.
#2 — Create a public jobs program, $200 billion a year. A proposal from Philip Harvey shows the effect on employment. The National Jobs for All Coalition, and Representative John Conyers have promoted such job creation programs for years.
____________________________________________________________
The math is fairly simple. Revenues increase by $1,346 billion, and $187 billion, and $111 billion for a total of $1,644 billion (8.4% of GDP) available for outlays. Paying off the deficit reduces the surplus by $453 billion, and then by $340 billion from new outlays. $453 + $340 = $793 billion. $1,644 - $793 = $851 billion for either tax cuts or additional social benefit expenditures. The RPB surplus stands at $851 billion (4.3% of GDP). This is a surplus unheard of, and it is an opportunity for tax cuts to the lower-earning 90% who earn 54.1% of all income and pay 50.1% of all taxes, states the report “Who Pays Taxes in America in 2017?”
The Supplemental Poverty Measure, from the U.S. Census, (Figure 6) shows that 40.8% of the “total population” live in households whose income is 4 times above the poverty level. This is before paying taxes. After all taxes and government transfers, only 21.0% are 4 times above the poverty level. About a fifth of Americans move below the 4 times poverty level due to their tax burden. The RPB could reduce their federal tax burden by half!
Household poverty median 4 times % of population
Size income income income
1 $12,060 $30,367 $48,240 28%
2 $16,240 $65,627 $64,690 34%
3 $20,420 $76,936 $81,860 15%
4 $24,600 $91,036 $98,400 13%
5+ about $30,000 $82,000 $120,000 9%
(from U.S. Census, here)
Perhaps this is too big a tax cut, as the resources still are needed for programs such as pre-K education, housing, infrastructure and more. But this tax cut would greatly increase aggregate demand which powers about 70% of economic activity. It is a complicated analysis. For instance, for single person households, 28% of the population, their median income is $30,367, and 4 times the poverty threshold is an income of $48,240; and 35% have incomes above $48,420. So, 35% would see significant tax reduction. And so on, we could figure out how many would have tax reduction. Without further detail, it’s safe to say that many moderate to high income families, incomes between $50,000 and $150,000 would see tax relief.
This will recharge the economy that is 70% powered by consumer consumption. It will also improve the savings rate and relieve the precariousness of life for the 78% of full-time workers who live paycheck to paycheck, and the 45% of adults who say they could not pay-off a $400 emergency expense in 30 days. The lives of those with lower incomes will be improved due to the jobs program and the EITC increase. It improves the standard of living for 90% of America. It has democratic appeal. It’s time for Americans to reflect on their nation's economy and devise practical measures to share our abundant prosperity.
There are many more reforms needed to improve the economy and end the squandering of the surplus. Only an informed and concerned citizenry can make these reforms.
This article by Lance Taylor at INET best explains the economic overhaul needed, in which he states,
"What is required are policies that go beyond the tax code to shift the very balance of power between workers and employers. Doing so would allow real wages to catch up to productivity and capital gains to be more equitably shared among the population. It would shrink inequality for years to come."
______________________________________________
Reasons to Dislike the Republican Budget Plan
Income has not kept up with growth -- for example, the Pew Research Center shows that in 1970 the median income for younger adults age 18 to 34 was $27,300, and in 2014 it had sunk to $15,000. Marriage rates are also way down. The "average weekly (and also yearly) income of the production and non-supervisory employee has risen by 11% since 1964, the per capita economy has grown by 177%.
The Center for Budget and Policy Priorities has published many reports, and this one is extensive. Here are a table and a graph from the report; it shows median household income increasing by 3% in 36 years, 1979 to 2015. The "per capita disposable income" increased by 91% in the same period, from $20,248 to $38,720, in "chained (2009) dollars" says the site BEA.gov, Table 2.1. (I found that it's difficult to read this chart, but it can be done.)
An early report stated that 80% of the tax reductions in Trump’s budget would go to just 1% of all households. Now it appears that the 1% will get 31% of cuts in the first year and 48% in the last year (there are several reports from the Institute on Taxation and Economic Policy.) The lower-earning two thirds of Americans, with incomes below $75,000, would experience effectively a net loss of income, according to this Washington Post article. The Ryan budgets in past years would decrease spending by 42% on social programs that benefit mostly elders, disabled adults and poor children. The CBPP.org has published extensively about the bill and believes cutting social benefits is still the actual agenda yet to surface with the current bill. About 13 million Americans will lose their health care insurance. The bill is apt to raise the debt from 77% of GDP to 99%. And economic growth would not improve to the level the GOP predicts, state several reports -- the Wharton School at Univ. of Pennsylvania, and the CBO report of 11/16/17. What's not to like? What is to like?
Reasons to Dislike the Republican Budget Plan
Income has not kept up with growth -- for example, the Pew Research Center shows that in 1970 the median income for younger adults age 18 to 34 was $27,300, and in 2014 it had sunk to $15,000. Marriage rates are also way down. The "average weekly (and also yearly) income of the production and non-supervisory employee has risen by 11% since 1964, the per capita economy has grown by 177%.
The Center for Budget and Policy Priorities has published many reports, and this one is extensive. Here are a table and a graph from the report; it shows median household income increasing by 3% in 36 years, 1979 to 2015. The "per capita disposable income" increased by 91% in the same period, from $20,248 to $38,720, in "chained (2009) dollars" says the site BEA.gov, Table 2.1. (I found that it's difficult to read this chart, but it can be done.)
| APPENDIX TABLE 1 | ||||||
|---|---|---|---|---|---|---|
| Real Median Household Income for Three-Person Working-Class Households | ||||||
| Working Class (No One in Family Has a Bachelor’s Degree) | At Least One Person Has a Bachelor’s Degree | |||||
| White | Black | Hispanic | Other | Total | ||
| 1979 | $50,200 | $34,300 | $37,000 | $40,500 | $47,400 | $68,500 |
| 2015 | $55,000 | $38,100 | $41,800 | $46,600 | $48,700 | $84,200 |
| Percent change | 9% | 11% | 13% | 15% | 3% | 23% |
Note: Incomes shown in 2015 dollars. Household incomes take into account taxes and benefits from transfer programs and are adjusted for inflation and family size.

An early report stated that 80% of the tax reductions in Trump’s budget would go to just 1% of all households. Now it appears that the 1% will get 31% of cuts in the first year and 48% in the last year (there are several reports from the Institute on Taxation and Economic Policy.) The lower-earning two thirds of Americans, with incomes below $75,000, would experience effectively a net loss of income, according to this Washington Post article. The Ryan budgets in past years would decrease spending by 42% on social programs that benefit mostly elders, disabled adults and poor children. The CBPP.org has published extensively about the bill and believes cutting social benefits is still the actual agenda yet to surface with the current bill. About 13 million Americans will lose their health care insurance. The bill is apt to raise the debt from 77% of GDP to 99%. And economic growth would not improve to the level the GOP predicts, state several reports -- the Wharton School at Univ. of Pennsylvania, and the CBO report of 11/16/17. What's not to like? What is to like?
______________________________________________
Additional Reading:
My essay "Solutions" best summarizes my vision for improving the economy, December, 2016.
Additional Reading:
My essay "Solutions" best summarizes my vision for improving the economy, December, 2016.
This essay of 12/21/17 by Robert Greenstein at CPBB describes the threat to the poorest Americans as the GOP targets government benefits to the poor to balance the revenue losses from their tax cuts.
Two-thids of all SNAP food aid go children, seniors and disabled adults. Cuts to SNAP will reach 30% by 2027.
The report from Citizens for Tax Justice appears to me as the most balanced and comprehensive report on the Trump budget. The top 1% receive 31% of budget cuts in 2017 and 48% in 2027. The most important fact is the distribution of income, not the tax proposals. That's where the real reform must happen.
Eleven graphs from the best of 2016 from Dollars and Sense magazine, present forecasts of effects of the Sanders' budget in wage increases and budget revenue increases over ten year, and more. And the article "'Medicare for All' Could Be Cheaper Than You Think" is a persuasive argument for creating a dual option for consumers, either insure with private or enroll with Medicare. It reduces total health care costs substantially.
Here's an excellent article on the state of inequality by Richard Eskow.
And here's the New York Times editorial critical of the Trump budget. The Tax Policy Center concludes the Trump budget will fail to increase the GDP sufficiently to pay for the tax cuts. Another article claims the budget will reduce housing by over 1 million units in the next decades. And this report from the EPI states the average tax cut for the top 1% will be $207,000. There are many critical appraisals of the Trump budget, just look for "80% of tax benefits go to 1%."
Robert Pollin outlines a progressive future in this article.
Matt Bruenig at Demos provides a very detailed 50 year overview of the composition of all taxes, local, state, and federal, and nontax revenues which accounted for 90% of the new revenue since 1970.
 ______________________________________________________
Median Income data, 2016:
The Social Security Administration filed its report on wage income, and $30,557 was the median -- the income for the middle worker on the income ladder -- for 163 million workers. From 1990 to 2016 the median has grown by 16% or 0.6% a year. In contrast the "Disposable personal income" per capita in chained dollars, 1990 to 2016, has grown by 52%, 3 times faster.
The lower half of all earners/workers earned 6.7% of all "Personal Income" (from BEA.gov, personal income, Table 2.1), and they earned 13.5% of all wage income. There are 81.5 million workers in the lower half.
I don't like to interpret facts and data, but for the sake of some of my friends, this means wages have lagged far behind the growth of the nation, in fact at least half the nation's workers have been left out of most (⅔) of the growth over 26 years. The top one percent saw their incomes triple (an increase of 200% since 1980.) The average growth for the entire lower half was not 16%, it was 1%, according to research from the Washington Center on Equitable Growth.
If median had grown by 52% over 26 years then the median today would be $40,091, about a third greater. If the minimum wage were 60% of the average income it would be $15.64 an hour, and if it were 60% of the median it would have been $13.44 an hour in 2016. Instead, it is actually just over half of $13.44 per hour. The average hourly wage for production and non-supervisory workers, 2017 October, is $22.22 an hour. A minimum at 60% of that average would be $13.33 an hour. Instead, today's minimum is 33% of the "average hourly earnings" when it should be about 60%.
After absorbing the facts in the article "A Tale of Two Countries" I discovered the following shocking fact:
The poorer 50% of France's population has an average per adult income 16% higher each year than the lower half of the U.S. population, per adult --- $18,792 in France, $16,200 in the U.S. France's per capita income and GDP is smaller by a third than the U.S. per capita, -- GDPs of $36,855 per cap in France, $57,466 in the U.S. (World Band stats) Another way to say this is -- if the U.S. had the same distribution ratios as France, the lower-earning half of U.S. adults would not earn $16,200 a year but $29,300 a year --- nearly double. This would diminish U.S. poverty. Since 1980 the $16,200 average adult income has increased by $200, or 1%. In France their lower-half average increased by the rate of growth, 32%. This comes from Washington Center for Equitable Growth, A Tale of Two Countries. France taxes at a much higher rate, so their social benefit programs are more generous, and this after-tax income is not included in the calculations. Michael Moore's movie Where Shall We Invade Next? shows a French school lunch room where the kids are served meals on actual ceramic plates and eat near gourmet quality food with the teacher helping with etiquette. They are not richer, just have a different set of priorities.
_____________________________________________________
Two Letters to the Mariposa Gazette,
Nov. and Dec., 2017, Trump/Republican Tax Plan
Nov. and Dec., 2017, Trump/Republican Tax Plan
The Trump/Republican tax plan is absurd and harmful. The majority of voters in this county should take a closer look. The broad picture should be emphasized over and over until the entire population gets it. The Trump tax plan showers 80% of its tax cuts and benefits on the top-earning one percent. The top one percent will see an average cut of $64,720 a year, says the editorial at the New York Times. Another study from the Economic Policy Institute places the average tax cut at $207,060. This one percent has an average household income of $2.6 million a year, it earned 21.7% of all income in 2016, and it has an average savings of around $30 million. In the 34 year period from 1980 to 2014, the top one percent tripled their incomes from $433,000 a year to $1.3 million per adult, so a couple’s average income is $2.6 million. The lower-earning half of U.S. adults saw his or her average income grow by $200, from $16,000 to $16,200 over a 34 year period, states a report from the Washington Center for Equitable Growth. There couldn’t be a worse time to hand out tax breaks to the wealthiest.
Since the 2008/9 recession household savings has doubled, believe it or not. Total net worth went from
$48 trillion to $96 trillion, says the Federal Reserve’s Flow of Funds report. That comes to approximately $400,000 for every adult. We are a wealthy nation. Unfortunately that wealth is not distributed fairly.
The lower-saving half of the U.S. owns just 1.1% of all wealth, the top one percent owns 38.5%, the top ten percent own 75%. While the “average” wealth doubled in 9 years, the net worth of the household in the middle dropped by 28% during the same period, from $135,000 to now $97,200 (up from $83,000 in 2013) states the Fed’s Survey of Consumer Finances. The “average” household net worth, states the SCF, stands at $692,100. But the middle household owns only one seventh that amount, $97,200. And worse, a third of Americans live in homes with zero in “non-home” assets. Another Fed report states that 44% of U.S. adults cannot pay-off an emergency expense of $400 in a 30 day period. About 28% live in homes that do not have a “safe and decent” standard of living, says the author of the U.S. Census Supplemental Poverty Measure.
Consumer demand expands the economy and creates new jobs, not tax cuts to the wealthy. The tax proposal is rightly called Voodoo economics. The economy needs reforms that boost average wage earners' incomes, and the federal budget needs much higher taxes on the wealthiest. Their incomes tripled while a majority saw their income growth come to a halt. I write a blog, Economics Without Greed.
Yes, that was an overwhelming display of numbers, but the general idea should be clear.
Yours, Ben Leet
_____________________________________________________
and the second letter, December 30, 2017
______________________________________________________
My thinking takes me back to this graph from the University of Texas Inequality Project, from a paper by Olivier Giovannoni on labor's share of income. The same paper is published at the Levy Economics Institute, Working Paper 805. I reproduced it in this July 2016 essay.
It shows that the lower-earning 90% of workers saw their share of the national income decline from 55% to 37% between 1981 and 2010. A drop of 18% of the national income is about
$26,000 per household
among the lower-earning 90%. Read page 33 of the Giovannoni report where he estimates a drop of 18 points to a level not seen since the 1930s. He seems to revise in the Levy publication the 18 points to 15 points, which means a decrease in annual income of $21,600 for all 112 million households in the lower-earning 90%, a transfer of $2.4 trillion yearly. And readers may confirm the distribution figures by inspecting the web page State of Working America, Income, Table.2.4; if one bothers to compare the "wage income" portion for the lower 80% of households, and multiply by the total portion wage income occupies in the national income, the total going to the lower 80% also confirms -- a total of 27.3% of all income goes to the wages of the lower-earning 80% (50.2% of wages which are 54.3% of total income when multiplied = 27.3% of all income), which compares to 37% going to the lower 90% in Giovannoni's report.
The Lance Taylor article I quote from notes that real change may take 30 to 40 years, and it will involve far more than tax shifts and boosts in minimum income. It will take a redefining of power between workers and owners.
_____________________________________________________
and the second letter, December 30, 2017
The recent Republican tax cuts will not benefit the majority of Americans, even with the rosiest of outcomes. For the first year, 2019, they distribute 52% of their benefits to the top-earning 5% of U.S. households, and by 2027 tax increases face the lower-earning 60% (see the ITEP report). The central strategy is to increase the incomes of the wealthiest and hope for trickle-down. This will not restore prosperity to lower-earning families, perhaps half of the nation. Since the 1980s, and even before, economic growth has not reached the average worker. Here are two examples:
In 1960 a young male worker, between ages 18 and 34, earning the middle or median income for this age group, earned $27,300 a year. Jobs were abundant, wages were high. Wages had quadrupled for this age group in just 20 years since 1940. But then came a long, slow decline, and young male workers’ earnings have dropped to $15,000, about half what they were 57 years ago. The economy is about three times more productive than in 1960, on a per person basis. But inequality is much higher. This comes from a Pew Research Center report of 2016 drawing on U.S. Census data. If we wish to “Make America Great Again” we will have to restore higher incomes to younger workers, to low-earning workers, and in fact most all workers. The share of the national income earned by the lower-earning 90% has fallen by 18% according to some studies. This is a large dollar amount, $2.9 trillion a year, and it is over $26,000 per family in the entire lower 90%. Since other poorer nations in the world have higher living standards than the U.S., it’s a matter of policy choice as to how prosperity is shared. The second example comes from a study that shows since 1980 the lower-earning half of U.S. adults have seen their incomes increase by 1%, from $16,000 to $16,200, while the top one percent earners have had an increase of over 200%, from $420,000 to $1.3 million a year per adult. (see equitablegrowth.org A Tale of Two Countries) The gap between the two groups tripled from 27 times to 81 times. This extreme ratio is similar only in the poorest nations such as the Democratic Republic of the Congo, the Central African Republic, and Burundi. If the U.S. economy achieved the same income distribution as France, for instance, the average income per adult for the lower-earning 50% would be $29,000 a year, not $16,200. The economy is not serving the lower earning 80%. America is in a crisis, economically. Fortunately, measures could be put in place to restore a balanced distribution.
Josh Bivens, writing at the Economic Policy Institute in this past month stated, “Had this upward redistribution not happened, incomes for the bottom 90 percent of Americans would be roughly 20 percent higher today. In short, the rise in inequality driven by anemic wage growth has imposed an ‘inequality tax’ on American households that has robbed them of a fifth of their potential income.” I think 20% understates the amount of income lost, other economists calculate a loss of 32%. The $26,000 of lost income I suggest above equals this 32% annual loss for 112 million households, 90% of American households. I write a blog, Economics Without Greed, and many reputable sources are referenced there for this argument.
Ben Leet
My thinking takes me back to this graph from the University of Texas Inequality Project, from a paper by Olivier Giovannoni on labor's share of income. The same paper is published at the Levy Economics Institute, Working Paper 805. I reproduced it in this July 2016 essay.
It shows that the lower-earning 90% of workers saw their share of the national income decline from 55% to 37% between 1981 and 2010. A drop of 18% of the national income is about
$26,000 per household
among the lower-earning 90%. Read page 33 of the Giovannoni report where he estimates a drop of 18 points to a level not seen since the 1930s. He seems to revise in the Levy publication the 18 points to 15 points, which means a decrease in annual income of $21,600 for all 112 million households in the lower-earning 90%, a transfer of $2.4 trillion yearly. And readers may confirm the distribution figures by inspecting the web page State of Working America, Income, Table.2.4; if one bothers to compare the "wage income" portion for the lower 80% of households, and multiply by the total portion wage income occupies in the national income, the total going to the lower 80% also confirms -- a total of 27.3% of all income goes to the wages of the lower-earning 80% (50.2% of wages which are 54.3% of total income when multiplied = 27.3% of all income), which compares to 37% going to the lower 90% in Giovannoni's report.
The Lance Taylor article I quote from notes that real change may take 30 to 40 years, and it will involve far more than tax shifts and boosts in minimum income. It will take a redefining of power between workers and owners.

Here's a link to a graph of government spending among developed nations, from the OECD. Among 32 nations the U.S. ranks 24th for the amount of government spending relative to its economy. The U.S., at all levels of government, spends 37.6% of GDP on government. Germany spends 43.8% or 6.2% more. The Radical Populist Budget I outline raises U.S. spending level to just below Germany's.
Germany's "Gini coefficient before taxes for households' market income" registers 0.504, higher than the U.S. with 0.486. This is a measure of pre-tax inequality. After taxes and transfers Germany measures 0.295, and the U.S. 0.378. Germany with very high inequality, higher than the U.S., lowers it by 0.207, and the U.S. lowers its Gini by 0.108. This info I take from the table on page 164 from the book Restoring Shared Prosperity, an essay by Eckhard Hein. It appears that Austria, Belgium and Finland reduce inequality even more than Germany, all of the other 14 nations in the table reduce inequality more than the U.S. does. And they do not have enormous military spending ballooning their expenditures.
The United Nations publishes a Human Development Index, and another index "Adjusted for Inequality". The U.S. places 10th among all nations before adjusting for Inequality, and falls to 20th place after. Germany ranks at 3rd place before Inequality, and at 4th place after. The Wikipedia article shows the nations ranking more clearly than the table at the U.N. These nations drop more than 10 places, exceeding the U.S. in inequality drops: Korea, Israel, Panama, Brazil, Mexico, Venezuela, Chile and Iran (Iran does the worst dropping 40 places). Among the top 60 nations only Argentina and Panama score worse than the U.S. in terms of inequality of income. And as I wrote in the second "Letter to the Editor", above, taking from the report "A Tale of Two Countries", only The Democratic Republic of the Congo, The Central African Republic and Burundi have a greater income gap between the top 1% and the lower 50% than that of the U.S. !!!! The U.S. has great potential for improvement.