LABOR DAY, 2015
unemployed, under-employed involuntarily, or working full-time and year-round for poverty wages (1) -- see graph below
46 % of workers in 2013 earned less than $25,000 for the year (see reference 2 below). The poverty threshold for 2014 for a four person family was $24,008. the average yearly income for 46 % of workers is $12,365 (#2 below). Two average workers earning below the median would earn less than the poverty level for 2014. Most researchers say this official poverty rate is much too low. The U.S. Census states (page 6) that of Poor Americans age 18 to 64, half are working poor, this is 13 million. 13 million is also 9%, or 1 in 11, of daily workers. the combined income of half of u.s. workers totals less than 8 % of national income. only 18 % of daily workers are classified as part-time workers. 82% are full-time.
Income:
Median worker income — $28,031 in 2013 (2)
46 % of workers earned annually less than $25,000, just above
the poverty level for a family of four (2)
The typical family of four had about $63,000 in expenses (3)
USA today says that $58,491 is the annual expenses for a 4
person family.
44 % of u.s. children live in low income or poor families (4)
with incomes below $47,248 per year, about double the
official poverty level
Average household savings, 2015 — $691,000 (7)
Sources:
(1) National jobs for all coalition, (employment) september 2015
(2) Social Security Administration wage report, Oct. 2014
(3) basic Family budget Calculator, EPI.org, for 2015
(4) basic facts about low-income children, nccp, 2015
(5) CBO, Distribution of Household income and federal taxes, 2011, (2014) page 2
i used the cbo total national income and divided by number of workers
(6) CBO report, page 2, i adjusted the 2011 figure, $93,900, for inflation
23.6% -- I get most of my info from National Jobs for All Coalition. They have updated their web page. Here's their graph showing the real under-employment rate of over 12.1%. Dec. 5, 2015 official U6 unemployment is 9.9%, the NJFAC says it should be 12.1%. They say that 19.8 million or 12.1% of the labor force are out of full-time work. Add those not paid above poverty level wages, the rate is 23.5%.
The Economic Populist web page has a thorough employment report.
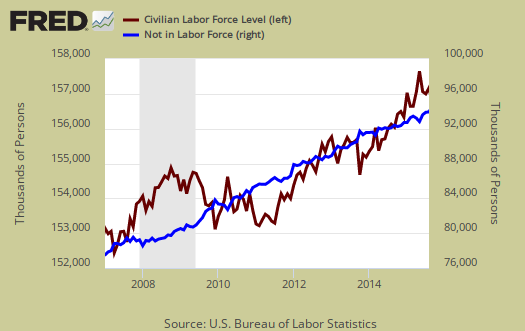 This graph from the Economic Populist shows that while the labor force grew by 4 million in the past 7 years, the "Not in Labor Force" grew by 16 million. Note the stagnation of the maroon line 2009 to 2012. The U.S. Census, see here, shows that citizens aged between 65 and 69 increased by 2.2 million between 2010 and 2013, a three year period. At that rate over an 7 year period 5.1 million would age out of the labor force, not 16 million. See, here, the "Not in Labor Force" graph from the St. Louis FRED Federal Reserve graph. It shows a 16 million increase since 2008. The employment to population ratio has not been as low since 1977 (38 years) and the employment to population ratio for prime working age, 25 to 54, has not been this low since 1984 (31 years).
The Economic Populist concludes:
"This month's CPS report warns. To focus on just the plunging official unemployment rate is a huge mistake. Underneath the numbers shows a disturbing trend of people just dropping out of the count. The never ending low labor participation rates are just not changing and simply cannot be explained by baby boomers retiring."
The September, 2015, unemployment report, according to the NJFAC report, shows that
23.5% of the work force are either unemployed, involuntarily part-time workers, or working full-time year-round for less than the poverty level for a family of four ($24,008). The numbers read: 7.9 million unemployed, 6.0 million involuntarily working part-time, 6.0 million "not counted in the official statistics" and 18.5 million working for low wages -- 38.4 million total, 23.5% of work force. Confirming this statistic is the Social Security report that shows 46% of all workers earn less than $25,000 annually, and their average annual income is $12,365, about $1,000 a month, well below poverty for a single individual. The U.S. Census report Supplemental Poverty Measure shows, page 6, that 9% of all workers (or 13.3 million) live in poverty, and 43% of that total "worked full-time year-round". See BLS on part-time workers, here. The household average income for 2011 was $93,900 according to the CBO report, and inflation adjusted to 2015, that's $99,000.
82% of the work force are non-supervisory workers
23.6 % of the U.S. labor force,
nearly one in four workers,
nearly one in four workers,
or 39 million American workers,
are eitherunemployed, under-employed involuntarily, or working full-time and year-round for poverty wages (1) -- see graph below
46 % of workers in 2013 earned less than $25,000 for the year (see reference 2 below). The poverty threshold for 2014 for a four person family was $24,008. the average yearly income for 46 % of workers is $12,365 (#2 below). Two average workers earning below the median would earn less than the poverty level for 2014. Most researchers say this official poverty rate is much too low. The U.S. Census states (page 6) that of Poor Americans age 18 to 64, half are working poor, this is 13 million. 13 million is also 9%, or 1 in 11, of daily workers. the combined income of half of u.s. workers totals less than 8 % of national income. only 18 % of daily workers are classified as part-time workers. 82% are full-time.
Income:
Median worker income — $28,031 in 2013 (2)
46 % of workers earned annually less than $25,000, just above
the poverty level for a family of four (2)
The typical family of four had about $63,000 in expenses (3)
USA today says that $58,491 is the annual expenses for a 4
person family.
44 % of u.s. children live in low income or poor families (4)
with incomes below $47,248 per year, about double the
official poverty level
average worker income — $79,183 (5)
Average household income — $99,618 (6)
extremely high incomes raise the average. Ditto for wealth.
wealth:Average household savings, 2015 — $691,000 (7)
median household savings, 2010 — $77,300 (8)
31% of households have zero or negative
“non-home” savings (9)
50% of households have less than $10,000 in
50% of households have less than $10,000 in
“non-home” saving (9)
(1) National jobs for all coalition, (employment) september 2015
(2) Social Security Administration wage report, Oct. 2014
(3) basic Family budget Calculator, EPI.org, for 2015
(4) basic facts about low-income children, nccp, 2015
(5) CBO, Distribution of Household income and federal taxes, 2011, (2014) page 2
i used the cbo total national income and divided by number of workers
(6) CBO report, page 2, i adjusted the 2011 figure, $93,900, for inflation
(7) Federal Reserve Bank, flow of Funds, page i, September 2015
(8) federal reserve, survey of consumer finances, page 17
(9) edward wolff, the asset price meltdown, 2012, Page 10, and Table 1
(8) federal reserve, survey of consumer finances, page 17
(9) edward wolff, the asset price meltdown, 2012, Page 10, and Table 1
23.6% -- I get most of my info from National Jobs for All Coalition. They have updated their web page. Here's their graph showing the real under-employment rate of over 12.1%. Dec. 5, 2015 official U6 unemployment is 9.9%, the NJFAC says it should be 12.1%. They say that 19.8 million or 12.1% of the labor force are out of full-time work. Add those not paid above poverty level wages, the rate is 23.5%.
Welcome to NJFAC


The Economic Populist web page has a thorough employment report.
This graph from the Economic Populist shows that while the labor force grew by 4 million in the past 7 years, the "Not in Labor Force" grew by 16 million. Note the stagnation of the maroon line 2009 to 2012. The U.S. Census, see here, shows that citizens aged between 65 and 69 increased by 2.2 million between 2010 and 2013, a three year period. At that rate over an 7 year period 5.1 million would age out of the labor force, not 16 million. See, here, the "Not in Labor Force" graph from the St. Louis FRED Federal Reserve graph. It shows a 16 million increase since 2008. The employment to population ratio has not been as low since 1977 (38 years) and the employment to population ratio for prime working age, 25 to 54, has not been this low since 1984 (31 years). The Economic Populist concludes:
"This month's CPS report warns. To focus on just the plunging official unemployment rate is a huge mistake. Underneath the numbers shows a disturbing trend of people just dropping out of the count. The never ending low labor participation rates are just not changing and simply cannot be explained by baby boomers retiring."
The September, 2015, unemployment report, according to the NJFAC report, shows that
23.5% of the work force are either unemployed, involuntarily part-time workers, or working full-time year-round for less than the poverty level for a family of four ($24,008). The numbers read: 7.9 million unemployed, 6.0 million involuntarily working part-time, 6.0 million "not counted in the official statistics" and 18.5 million working for low wages -- 38.4 million total, 23.5% of work force. Confirming this statistic is the Social Security report that shows 46% of all workers earn less than $25,000 annually, and their average annual income is $12,365, about $1,000 a month, well below poverty for a single individual. The U.S. Census report Supplemental Poverty Measure shows, page 6, that 9% of all workers (or 13.3 million) live in poverty, and 43% of that total "worked full-time year-round". See BLS on part-time workers, here. The household average income for 2011 was $93,900 according to the CBO report, and inflation adjusted to 2015, that's $99,000.
Non-supervisory workers’ average weekly earnings are
4% lower than they were in 1964. See St. Louis Federalreserve bank graphs, FRED, and adjust for inflation82% of the work force are non-supervisory workers
Since 1964, the output of the U.S. economy has nearly tripled on a per person
basis (increasing the per capita disposable income by 175%), according to the
Bureau of Economic Analysis, BEA.gov. (See Table 2.1, personal income, Disposable personal income)
A report from the economic policy
institute states that since 1979 the income of the top 1% tripled (increased by
200.3%), while the income for the lower 99% increased by 18.9%. The 1% captured
53.9% of all income growth. (increasingly unequal states of america, epi.org)
Another report, here, states that the world's wealthiest 400 individuals, the Forbes 400, on average own $5.8 billion each. In 1982 this inflation adjusted average was $570 million, indicating a ten fold increase, or a 900% increase, in 30 years. The rest of the U.S. population increased their private savings by only 30% over 30 years, 1% per year. And Edward Wolff says that the median household's wealth has decreased to its 1969 level, while the economy, per person, has almost tripled its output, a 175% per capita increase.
In a broader contrast to the entire world, the U.N. report on Food and Agriculture, page 2, states that more than 1 in 3 humans, or 2.2 billion humans, survive on less than $2 a day, less than $730 a year. That statistic does not convey it's real meaning, it is too dry. We should feel the individual hunger and insecurity of those 2.2 billion humans.
The Credit Suisse Bank report, World Wealth Report, 2015, states that the world average savings per adult is now $52,432 (page 5) but the median adult wealth is $3,200, and the top 1% own more than half of all private wealth, and the top 10% own 87.7%, while the lower-saving 50% own less than 1% of all wealth (pages 18 and19). A stunning article about wealth disparity in the U.S. shows that about 1 in 5 american adults are very poor, data is taken from this World Wealth Report.
All in all, this story contradicts our values, our concepts of personal success. We have to adjust our values. Not only is the natural world in danger -- the climate, the soil, water resources, oceanic aquatic life -- our excessive inequality threatens civilization. We humans require harmonious social coordination for survival, and it is the source of our dignity. But the pursuit of endless accumulation, the signal of success, has reached anti-social and absurd levels. Now the most vaunted success portends the collapse of our species' survival. Absurd? We have met the enemy . . .
Personally, I like the next blog entry better. It has much more basic info in it.
This was my Labor Day message. I've yet to distribute the paper copies I made. It was a holiday, and who is interested in a topic like inequality on a holiday?

Olivia Holmes leads the High Peaks Twirlers during the Louisville Labor Day Parade on Monday. For more