The Enormity of the Recession
and the Closing of a Local Nursing Home
Here are two letters I wrote recently, the first a letter-comment at an article by William Black who wrote about the financial collapse and control fraud, published at EconoMonitor. The second I sent to my local newspaper, the Mariposa Gazette, about the closing of a nursing home wing at the local hospital.
But my best articles are the three previous ones.
___________________________
First, see a video about U.S. wealth distribution, a new video here.
Too Much, a weekly newsletter, on March 4, 2013, featured this video. In the same week's edition it shows a graph from a study by Edward Wolff showing the change in net worth from 1983 to 2010. I have used the E. Wolff study below in this report. To read the full Wolff report click here, "The Asset Price Meltdown and the Wealth of the Middle Class."
___________________________
 William Black's article at EconoMonitor argues that the major banks knowingly bought and sold bad mortgages, they colluded in the origination and sale of bad mortgage that were based on mis-appraisal of property value and contained lies about borrowers' income and assets, and criminality -- the looting of their own firms -- was at the heart of the financial system's meltdown. Here I examine a part of the damage caused by the collapse. I left this comment to the article.
The severity of the Great Recession has not been well reported. Immense damage was done to ordinary household budgets and savings.
A look at Edward Wolff's report of August 2012, "The Asset Price Meltdown and the Wealth of the Middle Class" states that median household net worth dropped, 2007 to 2010, from $107,800 to $57,000, a 47% drop in 3 years. The Wolff report, page 55, also reports that the median household's net worth sank below the 1969 level, a loss of about 40 years of savings. The ratio of median net worth to mean average net worth exploded from 1 to 3.7 in 1969 to 1 to 8.1 in 2010. Inequality was writ large. (In 1962, according to Wolff, the median household savings was $51,900 and the mean average household savings was $194,000. This is a ratio of 1 to 3.7. In 2010 the ratio was 1 to 8.1, median was $57,000 and average was $463,800.) The Congressional Research Service reports that half the U.S. households own 1.1% of all household net worth, the other half own 98.9%. Again, inequality writ very large. (see: http://www.epi.org/blog/confirming-redistribution-wealth-upward/)
The Federal Reserve's Survey of Consumer Finances, 2012, reports (on page 17) a median household net worth drop of 39% between 2007 - 2010 from $126,400 to $77,300, a regression to 1992 levels. The mean average household net worth declined by 15%, in comparison. As I've reported before, the lower-saving half of U.S. households own approximately $11,000 on average, while the average for all households is $498,000.
The Assets and Opportunities Scorecard states that 44% of the nation are poor:
"For the second year in a row, the Assets & Opportunity Scorecard, finds that nearly half (43.9%) of households—equivalent to 132.1 million people—do not have a basic personal safety net to prepare for emergencies or future needs, such as a child’s college education or homeownership. These families are considered “liquid asset poor,” meaning they lack the savings to cover basic expenses for three months if unemployment, a medical emergency or other crisis leads to a loss of stable income."
The Statistical Abstract states that the total U.S. household net worth declined by $12.9 trillion ($64,179 trillion to $51,309) in one year, 2007-2008, a 20% drop in household net worth.
In January economist Jack Rasmus on his radio broadcast claimed that 13.7 million home owners (mortgage payers) have lost their homes since 2006 through foreclosures or short sales. This is about 26% of all home owners.
Economist Sylvia Allegretto stated in The State of Working America's Wealth that home owner equity in U.S. homes had dropped from about 60% to below 40%, the first time that banks owned a majority of home owner equity.
State of Working America, 2012, the book from the Economic Policy Institute, states on page 376, "The median household had 22.0 percent less wealth in 2010 than it did in 1983, with median household wealth dropping from $73,000 to $57,000 over those 27 years. In 2010, more than 1 in 5 households (22.5 percent) had either zero or negative wealth."
This was a debt driven crisis and recession.

In Rasmus' book Epic Recession, page 232, he reports, "According to the business research firm, Thompson Reuters, between 2000 and 2007, more than $17 trillion in mortgages were bought by the shadow banks, half of which were sold off to foreign buyers." On the previous page he quotes a WSJ article, "Between 2004 and 2007, Lehman securitized more than $700 billion in assets, according to its annual filings. About 85% of these, or about $600 billion, were residential mortgages."
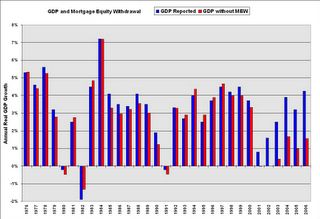
Without home-owners' withdrawing equity from their houses, how much growth would have the U.S. economy achieved in the 2000s? Here's a graph from Calculated Risk, as reported in Barry Ritholtz' book Bailout Nation (page 97): Click graph for a clearer view. In 2004 GDP growth was 4.2% including mortgage equity withdrawal (MEW) -- and without MEW extraction it would have been 0.8%. Why did not regulators at the Federal Reserve catch this? MEW was averaging an unprecedented 3% of GDP for 4 years, 2002 to 2006, as the article at Calculated Risk shows in another graph.
At this article by Dean Baker, March 2013, where he argues that Obama is to blame for the federal budget "sequester", Baker explains the effects of the decline of consumption, a $1 trillion decrease in spending. He states that when residential construction collapsed in 2007 the economy lost "$600 billion in annual demand"; and when the price of houses fell another $500 billion of annual consumption was lost. The gap between actual GDP and potential, a gap of $1.040 trillion, is reported at 6.5% by the Congressional Budget Office and the Bureau of Economic Analysis. Baker concludes, "The stimulus, which boosted demand by $300 billion a year in 2009 and 2010, helped to fill part of this gap, but it was nowhere near big enough." See this article and this article.
Between 1998 to 2008 financial corporate debt (bank debt) more than doubled, increasing by 130%, while the GDP per capita grew by 16%. The debt of financial corporations increased at 8 times the rate of growth, 1998-2008.
On Rasmus' page 220 he includes a table "Total Debt, U.S. 1978 - 2008", drawn from the Fed's Flow of Funds report, Table D.3, June11, 2009. It shows that between 1998 and 2008 "Financial Business" debt tripled, moving from $6,328 trillion to $19,486 trillion. Adjusted for inflation it increased by 130%. Total Domestic debt adjusted for inflation increased by 72%, in nominal terms from $22 trillion to $50 trillion. Total domestic debt therefore hit a record high of 74% of all household net worth. In the eleven years 1998 to 2008 the GDP per capita increased by 16% using the calculator at http://www.measuringworth.com/
While the GDP/capita increased, 1998 - 2008, by 16%, the financial corporate debt increased by 130% which is 8 times the increase of GDP/capita.
Were bankers simply ignorant of the extent of their loan exposure? Why would a financial system increase debt 8 times faster than economic growth over a ten year period? The end result was self-destruction and taxpayer bailout and enrichment of top banking executives. The reason according to William Black: control fraud.
It is about time the public wakes up to the criminality of this mess and finds the financial system guilty en masse, and then real reform will begin.
--- That last sentence is a so-so. Steve Keen's Debunking Economics has much the same conclusion, that credit over-reached and collapsed.
For William Black's article, click here.
http://www.economonitor.com/blog/2013/02/pervasive-fraud-by-our-most-reputable-banks/?utm_source=feedburner&utm_medium=email&utm_campaign=Feed%3A+economonitor%2FOUen+%28EconoMonitor%29
The graph from Too Much, March 3, 2013:

__________________________________________________
My letter to the editor about the closing of the Ewing Wing, the Nursing Home Facility
Last week's Gazette article about the impending closure of the nursing home facility at J C Fremont Hospital, the Ewing Wing, I believe deserves additional background. Mariposa resides in California's 4th Congressional District and this district elected by a 61% majority a representative who is wholly in line with the proposals of Paul Ryan, former vice presidential candidate. McClintock, our Congressman, sits on the House Budget Committee with Ryan. Ryan has proposed to scrap current funding of Medicaid and replace it with block grant funding. Currently half of Medicaid's expenditures go to nursing homes that serve senior adults who have spent down their assets to below $2,000. The Ryan proposal, to quote from a report from the Center for Budget and Policy Priorities, "would add millions to the ranks of uninsured. . . . would cause states to shrink the number of low-income people receiving health coverage through Medicaid by between 14 million and 27 million people by 2021, which would constitute an enrollment reduction of 23 percent to 46 percent (in addition to the 17 million people who would not gain Medicaid coverage due to the repeal of the ACA’s [often called ObamaCare's] Medicaid expansion)."
Approximately a quarter to half of the recipients of Medicaid care would have to go without. Where would they go? Federal funding of nursing homes across the nation would decline and many would be targeted in the crosshairs for closure.
The article mentioned 3 numbers: the daily expenses per patient at Ewing, the state's past per diem reimbursement and the state's future per diem reimbursement --- $395, $325, and $237, respectively. Converted to annual expenses per patient this equals $144,175, and $118,625, and $86,505. The state plans a 27% cut to its per diem reimbursement. Quite obviously nursing facility care is prohibitively costly to an ordinary citizen. The median household savings in 2010 was $77,800 according to the Federal Reserve. In fact the nation's medical costs are famously expensive. We spent in 2011 an amount equal to 17.9% of the nation's total economic output, GDP, double the percentage of other advanced nations. The OECD nations in 2009 spent on average $3,233 per year per citizen on health expenses, the U.S. spent $7,960. We spend two and a half times more for medical care and our medical outcomes are arguably less positive. We have the shortest life expectancy at birth and the highest infant mortality rate, to name two important outcomes.
Here's the CBO graph showing the expected effects of rising medical costs on the federal budget. Click here and read the entire article at the Incidental Economist site that explains well the run-away medical costs escalation. And James Kwak in 2010 used the graph in this articulate article. Kwak states, "If we don’t slow the growth of health care costs, there is no real solution to the deficit problem; the only way out from the budget perspective will be slashing Medicare, but that doesn’t solve the problem — it just shifts it onto individuals."
")
The Ryan Medicaid proposal would cut Medicaid funding and other federal health programs by 2050 by more than 75% according to the article at CBPP.org (see Ryan Medicaid Block Grant Would Cut Medicaid by One-Third by 2022"). The growing expenses of medical care in the U.S. are the sole reason for future federal budget deficits. The past drivers of the federal budget were the Great Recession, the unfunded wars in Iraq and Afghanistan, the unfunded Medicare Part D, and the Bush era tax cuts. Medical costs will be the main impetus for future deficits. All citizens will have learn more about our economy, how we prioritize and organize our resources and expenditures. I have written an economics blog for five years; on the Internet search for "Economics without Greed", or my name plus the word "economics".
Thank you, Ben Leet
OECD data: http://www.oecd.org/unitedstates/49084355.pdf
CBPP quote: http://www.cbpp.org/cms/index.cfm?fa=view&id=3751
Robin Hood in Reverse -- the Ryan Plan
P.S. --- March 20, 2013. The founder of The Center on Budget and Policy Priorities, Robert Greenstein, wrote a commentary on the Ryan Budget on March 12, 2013. Here is the first paragraph:
When House Budget Committee Chairman Paul Ryan released his previous budget last year, I wrote that for most of the past half century, its extreme nature would have put it outside the bounds of mainstream discussion. It was, I wrote, “Robin Hood in reverse — on steroids,” because it would have produced the largest redistribution of income from bottom to top in modern U.S. history. Ryan’s new budget is just as extreme. Its cuts in programs for low-income and vulnerable Americans appear as massive as in last year’s budget, and its tax cuts for the wealthiest Americans could be larger than in last year’s.
The Ryan plan proposes no new tax revenues and falls $5.7 trillion short on revenues over a 10 year period. This is a serious proposal? See this CBPP.org article.
____________________________________________________________
and the Closing of a Local Nursing Home
Here are two letters I wrote recently, the first a letter-comment at an article by William Black who wrote about the financial collapse and control fraud, published at EconoMonitor. The second I sent to my local newspaper, the Mariposa Gazette, about the closing of a nursing home wing at the local hospital.
But my best articles are the three previous ones.
___________________________
First, see a video about U.S. wealth distribution, a new video here.
Too Much, a weekly newsletter, on March 4, 2013, featured this video. In the same week's edition it shows a graph from a study by Edward Wolff showing the change in net worth from 1983 to 2010. I have used the E. Wolff study below in this report. To read the full Wolff report click here, "The Asset Price Meltdown and the Wealth of the Middle Class."
___________________________

The severity of the Great Recession has not been well reported. Immense damage was done to ordinary household budgets and savings.
A look at Edward Wolff's report of August 2012, "The Asset Price Meltdown and the Wealth of the Middle Class" states that median household net worth dropped, 2007 to 2010, from $107,800 to $57,000, a 47% drop in 3 years. The Wolff report, page 55, also reports that the median household's net worth sank below the 1969 level, a loss of about 40 years of savings. The ratio of median net worth to mean average net worth exploded from 1 to 3.7 in 1969 to 1 to 8.1 in 2010. Inequality was writ large. (In 1962, according to Wolff, the median household savings was $51,900 and the mean average household savings was $194,000. This is a ratio of 1 to 3.7. In 2010 the ratio was 1 to 8.1, median was $57,000 and average was $463,800.) The Congressional Research Service reports that half the U.S. households own 1.1% of all household net worth, the other half own 98.9%. Again, inequality writ very large. (see: http://www.epi.org/blog/confirming-redistribution-wealth-upward/)
The Federal Reserve's Survey of Consumer Finances, 2012, reports (on page 17) a median household net worth drop of 39% between 2007 - 2010 from $126,400 to $77,300, a regression to 1992 levels. The mean average household net worth declined by 15%, in comparison. As I've reported before, the lower-saving half of U.S. households own approximately $11,000 on average, while the average for all households is $498,000.
The Assets and Opportunities Scorecard states that 44% of the nation are poor:
"For the second year in a row, the Assets & Opportunity Scorecard, finds that nearly half (43.9%) of households—equivalent to 132.1 million people—do not have a basic personal safety net to prepare for emergencies or future needs, such as a child’s college education or homeownership. These families are considered “liquid asset poor,” meaning they lack the savings to cover basic expenses for three months if unemployment, a medical emergency or other crisis leads to a loss of stable income."
The Statistical Abstract states that the total U.S. household net worth declined by $12.9 trillion ($64,179 trillion to $51,309) in one year, 2007-2008, a 20% drop in household net worth.
In January economist Jack Rasmus on his radio broadcast claimed that 13.7 million home owners (mortgage payers) have lost their homes since 2006 through foreclosures or short sales. This is about 26% of all home owners.
Economist Sylvia Allegretto stated in The State of Working America's Wealth that home owner equity in U.S. homes had dropped from about 60% to below 40%, the first time that banks owned a majority of home owner equity.
State of Working America, 2012, the book from the Economic Policy Institute, states on page 376, "The median household had 22.0 percent less wealth in 2010 than it did in 1983, with median household wealth dropping from $73,000 to $57,000 over those 27 years. In 2010, more than 1 in 5 households (22.5 percent) had either zero or negative wealth."
This was a debt driven crisis and recession.
The Bureau of Economic Analysis (Department of Commerce) supplies the disposable income figure, and the savings rate figure, the Federal Reserve's Flow of Funds report supplies the aggregate household debt figure.
In Rasmus' book Epic Recession, page 232, he reports, "According to the business research firm, Thompson Reuters, between 2000 and 2007, more than $17 trillion in mortgages were bought by the shadow banks, half of which were sold off to foreign buyers." On the previous page he quotes a WSJ article, "Between 2004 and 2007, Lehman securitized more than $700 billion in assets, according to its annual filings. About 85% of these, or about $600 billion, were residential mortgages."
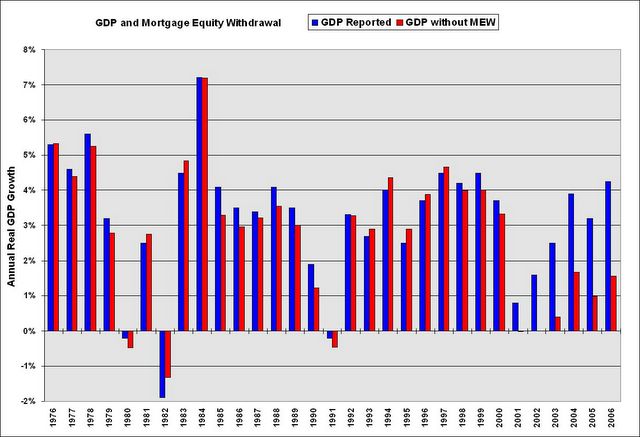
Without home-owners' withdrawing equity from their houses, how much growth would have the U.S. economy achieved in the 2000s? Here's a graph from Calculated Risk, as reported in Barry Ritholtz' book Bailout Nation (page 97): Click graph for a clearer view. In 2004 GDP growth was 4.2% including mortgage equity withdrawal (MEW) -- and without MEW extraction it would have been 0.8%. Why did not regulators at the Federal Reserve catch this? MEW was averaging an unprecedented 3% of GDP for 4 years, 2002 to 2006, as the article at Calculated Risk shows in another graph.
At this article by Dean Baker, March 2013, where he argues that Obama is to blame for the federal budget "sequester", Baker explains the effects of the decline of consumption, a $1 trillion decrease in spending. He states that when residential construction collapsed in 2007 the economy lost "$600 billion in annual demand"; and when the price of houses fell another $500 billion of annual consumption was lost. The gap between actual GDP and potential, a gap of $1.040 trillion, is reported at 6.5% by the Congressional Budget Office and the Bureau of Economic Analysis. Baker concludes, "The stimulus, which boosted demand by $300 billion a year in 2009 and 2010, helped to fill part of this gap, but it was nowhere near big enough." See this article and this article.
Between 1998 to 2008 financial corporate debt (bank debt) more than doubled, increasing by 130%, while the GDP per capita grew by 16%. The debt of financial corporations increased at 8 times the rate of growth, 1998-2008.
On Rasmus' page 220 he includes a table "Total Debt, U.S. 1978 - 2008", drawn from the Fed's Flow of Funds report, Table D.3, June11, 2009. It shows that between 1998 and 2008 "Financial Business" debt tripled, moving from $6,328 trillion to $19,486 trillion. Adjusted for inflation it increased by 130%. Total Domestic debt adjusted for inflation increased by 72%, in nominal terms from $22 trillion to $50 trillion. Total domestic debt therefore hit a record high of 74% of all household net worth. In the eleven years 1998 to 2008 the GDP per capita increased by 16% using the calculator at http://www.measuringworth.com/
While the GDP/capita increased, 1998 - 2008, by 16%, the financial corporate debt increased by 130% which is 8 times the increase of GDP/capita.
Were bankers simply ignorant of the extent of their loan exposure? Why would a financial system increase debt 8 times faster than economic growth over a ten year period? The end result was self-destruction and taxpayer bailout and enrichment of top banking executives. The reason according to William Black: control fraud.
It is about time the public wakes up to the criminality of this mess and finds the financial system guilty en masse, and then real reform will begin.
--- That last sentence is a so-so. Steve Keen's Debunking Economics has much the same conclusion, that credit over-reached and collapsed.
For William Black's article, click here.
http://www.economonitor.com/blog/2013/02/pervasive-fraud-by-our-most-reputable-banks/?utm_source=feedburner&utm_medium=email&utm_campaign=Feed%3A+economonitor%2FOUen+%28EconoMonitor%29
The graph from Too Much, March 3, 2013:
__________________________________________________
My letter to the editor about the closing of the Ewing Wing, the Nursing Home Facility
Last week's Gazette article about the impending closure of the nursing home facility at J C Fremont Hospital, the Ewing Wing, I believe deserves additional background. Mariposa resides in California's 4th Congressional District and this district elected by a 61% majority a representative who is wholly in line with the proposals of Paul Ryan, former vice presidential candidate. McClintock, our Congressman, sits on the House Budget Committee with Ryan. Ryan has proposed to scrap current funding of Medicaid and replace it with block grant funding. Currently half of Medicaid's expenditures go to nursing homes that serve senior adults who have spent down their assets to below $2,000. The Ryan proposal, to quote from a report from the Center for Budget and Policy Priorities, "would add millions to the ranks of uninsured. . . . would cause states to shrink the number of low-income people receiving health coverage through Medicaid by between 14 million and 27 million people by 2021, which would constitute an enrollment reduction of 23 percent to 46 percent (in addition to the 17 million people who would not gain Medicaid coverage due to the repeal of the ACA’s [often called ObamaCare's] Medicaid expansion)."
Approximately a quarter to half of the recipients of Medicaid care would have to go without. Where would they go? Federal funding of nursing homes across the nation would decline and many would be targeted in the crosshairs for closure.
The article mentioned 3 numbers: the daily expenses per patient at Ewing, the state's past per diem reimbursement and the state's future per diem reimbursement --- $395, $325, and $237, respectively. Converted to annual expenses per patient this equals $144,175, and $118,625, and $86,505. The state plans a 27% cut to its per diem reimbursement. Quite obviously nursing facility care is prohibitively costly to an ordinary citizen. The median household savings in 2010 was $77,800 according to the Federal Reserve. In fact the nation's medical costs are famously expensive. We spent in 2011 an amount equal to 17.9% of the nation's total economic output, GDP, double the percentage of other advanced nations. The OECD nations in 2009 spent on average $3,233 per year per citizen on health expenses, the U.S. spent $7,960. We spend two and a half times more for medical care and our medical outcomes are arguably less positive. We have the shortest life expectancy at birth and the highest infant mortality rate, to name two important outcomes.
Here's the CBO graph showing the expected effects of rising medical costs on the federal budget. Click here and read the entire article at the Incidental Economist site that explains well the run-away medical costs escalation. And James Kwak in 2010 used the graph in this articulate article. Kwak states, "If we don’t slow the growth of health care costs, there is no real solution to the deficit problem; the only way out from the budget perspective will be slashing Medicare, but that doesn’t solve the problem — it just shifts it onto individuals."
The Ryan Medicaid proposal would cut Medicaid funding and other federal health programs by 2050 by more than 75% according to the article at CBPP.org (see Ryan Medicaid Block Grant Would Cut Medicaid by One-Third by 2022"). The growing expenses of medical care in the U.S. are the sole reason for future federal budget deficits. The past drivers of the federal budget were the Great Recession, the unfunded wars in Iraq and Afghanistan, the unfunded Medicare Part D, and the Bush era tax cuts. Medical costs will be the main impetus for future deficits. All citizens will have learn more about our economy, how we prioritize and organize our resources and expenditures. I have written an economics blog for five years; on the Internet search for "Economics without Greed", or my name plus the word "economics".
Thank you, Ben Leet
OECD data: http://www.oecd.org/unitedstates/49084355.pdf
CBPP quote: http://www.cbpp.org/cms/index.cfm?fa=view&id=3751
Robin Hood in Reverse -- the Ryan Plan
P.S. --- March 20, 2013. The founder of The Center on Budget and Policy Priorities, Robert Greenstein, wrote a commentary on the Ryan Budget on March 12, 2013. Here is the first paragraph:
When House Budget Committee Chairman Paul Ryan released his previous budget last year, I wrote that for most of the past half century, its extreme nature would have put it outside the bounds of mainstream discussion. It was, I wrote, “Robin Hood in reverse — on steroids,” because it would have produced the largest redistribution of income from bottom to top in modern U.S. history. Ryan’s new budget is just as extreme. Its cuts in programs for low-income and vulnerable Americans appear as massive as in last year’s budget, and its tax cuts for the wealthiest Americans could be larger than in last year’s.
____________________________________________________________
No comments:
Post a Comment