My Blog List

Saturday, March 19, 2016

Trump's One Good Idea: Soak the Rich

                     PHOTO: Donald Trump appears on the cover of the New York Daily News on Nov. 10, 1999.
Trump’s One Good Idea

In 1999 Mr. Trump was running for president and broadcasting his ideas about the national debt. A November, 1999, article begins, “Billionaire businessman Donald Trump has a plan to pay off the national debt, grant a middle class a tax cut, and keep Social Security afloat: tax rich people like himself. . . . By Trump's calculations, his proposed 14.25 percent levy on such net worth [on individuals with net worth over $10 million] would raise $5.7 trillion and wipe out the debt in one full swoop. . . .  ‘Personally this plan would cost me hundreds of millions of dollars, but in all honesty, it's worth it,’ Trump said. ”

This might be Trump’s only good idea, I don’t know. In the article he called our capital “Disneyland-on-the-Potomac,” showing his flair for denigrating and humorous statements was alive back then. This “fell swoop” plan is absent in his present proposals. A 2015 article states that the head of the Committee for a Responsible Federal Budget  “estimates Trump's tax plan would increase public debt to 125% of the size of the economy by 2025, up from 74% today.” The very professional Tax Policy Center states that Trump’s current plan would increase the debt from its present $18 trillion to $33 trillion by 2036. Apparently Donald has parked his first “fell swoop” proposal.

I believe the controversy over the federal budget and the national debt is crucial to restoring prosperity to all Americans and should be a focus issue for all voters. Presently the average household annual pre-tax income is almost $100,000 (see here, page 2), and the average net worth is $700,000 (see here, also on page 2). But averages are misleading; the median household income in 2015 was $53,657 (the same level as 1996) and median net worth stands at $81,450 (less than it was in 1989). This is not shared prosperity. In the past 8 years total household net worth has increased by a nominal 55%, from $56 trillion to $87  trillion (see page 2). This is equal to an added wealth gain of $250,000 per household. But our prosperity is not shared. The top one percent, some 1.2 million households, together own $36 million millions, over $36 trillion, some 42% of all private savings (see here, page 42), averaging $30 million in savings (net worth) per household. The lower-saving half of U.S. households own 1.1% of all wealth

Perversely, during the past 8 years the median household's net worth has dropped by 40%. Since 1996 personal "disposable income" per capita has increased by 40%, since 1986 by 61%. But this too is a misleading average; the "Average Weekly Earnings of Production and Nonsupervisory Employees", 80% of all workers, is up 3% after 54 years, while the disposable income per capita has tripled, up 200%. The richest one percent received 19% of all income in 2015, and owned 42% of all private savings. These last paragraphs should shock a careful reader. The numbers tend to blur in the mind, so I hope you have re-read it slowly. 

A Trump plan to eliminate the national debt would be very feasible, since the debt is $18.4 trillion, and the national private savings is $86.8 trillion (see here, page i). The Public Debt, owed to private investors and foreign governments, is $13.8 trillion, one sixth the amount of U.S. private household net worth. This means the old Trump plan, the "fell swoop" at 14% would almost wipe out the Public Debt. 

My Congressman, Tom McClintock, and his Republican clan, are calling for drastic spending cuts in order to balance the budget. Raising taxes is off the table. Taxing private wealth is beyond his imagination. A financial transaction tax is adamantly opposed. My neighbor and I walk around together for exercise. He votes for McClintock because McClintock will balance the budget. You probably have many neighbors who do the same. I think Democrats should be able to explain why this Republican austerity program is a disaster. 


 This graph -- from the Economic Policy Institute -- and this NYTimes article -- and see graphs below, Nov. 2015, this blog, the Unemployment Story, Again -- show that government spending in the wake of economic recessions has plummeted since 2009. 

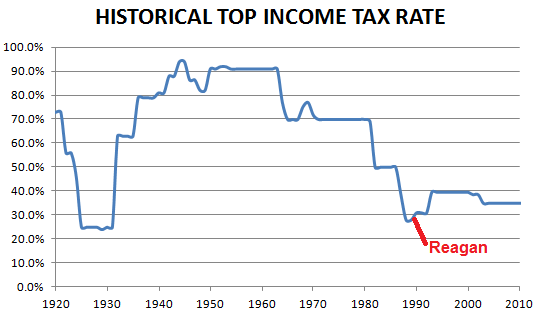
For 20 years, 1943 to 1963, the top marginal income tax rate was 90% on income that exceeded $1.6 million annually. For fifty years, 1930 to 1980, the average top income tax rate averaged 82%, see this article. During those 50 years the economic growth rate has never been surpassed, and prosperity enabled family income to double (inflation adjusted) at all income levels between 1946 and 1976. Between 1950 to 1970 the federal debt dropped from 90% of GDP to under 40%, even though the national budget was in deficit 15 of those 20 years (see Table 1.2, here). And infrastructure projects such as the Interstate Highway system and NASA’s  Apollo project were paid for. 

Austerity does not work. We have to repair the economy by spending intelligently. This may sound counter-intuitive, but it has worked successfully since FDR lowered the unemployment rate, 1933 to 1937, from 25% to 9.6%. Spending by government has increased prosperity, and deficits are manageable with shared growth, which we do not now have. 

_________________________________________________
Since writing this piece two excellent articles have appeared. "Thomas Piketty on the Rise of Bernie Sanders", and an article by Robert Pollin, "Bernie Sanders Will Make the Economy Great Again." They capsulize the economic drama the nation faces. Sanders represents a stark and much needed break from the 1980s to the present. A quick education is available by reading these two pieces. What the two authors leave out is the need to change the National Labor Relations Act of 1935, and that of 1947, which  would free up labor to win greater incomes from the corporations most workers work for -- this shift would change the inequality trend and bring about a shared prosperity. 

This piece will appear in the Mountain Democrat Newsletter, Oakhurst, CA, Spring 2016.
         

Friday, March 11, 2016

The 1950s and Today

Comparing the 1950s and Today --
                   Economics and Taxation                     

We remember the 1950s fondly because of 1957 Chevys, Elvis, President Eisenhower and sports stars like Willie Mays, Johnny Unitas, Rocky Marciano, Bob Cousy, Althea Gibson, Pancho Gonzalez, jockey Willie Shoemaker and Leo Nomellini who was a 6 time All NFL defensive and offensive tackle for the San Francisco Forty-Niners. 

                             2014-10-27-WillieMays.jpg                         Bob Cousy (1).jpeg
Rocky Marciano.jpg   Leo Nomellini.jpgImage result for Althea Gibson
Image result for Pancho Gonzales

Also we remember that mothers could be “homemakers” instead of employees at work, and buying a family home cost the equivalent of 2 years’ income, not today’s 3.5 years’ income with two earners in the family. Between 1947 and 1979 all income groups doubled their incomes, in inflation adjusted dollars. Times were good, incomes were rising for most but not all Americans. 


Our economy was much different, as was our federal taxation policy. In the 1950s society was  comfortable with a top marginal income tax rate of  90% on all income above today’s $1.6 million. After $1.6 million, the next dollar was worth just ten cents to the earner, and 90 cents to the federal government and society. For 20 years, 1943 to 1963, the top rate averaged over 90%. 

Today the average pre-tax income of the top 1% of taxpayers, some 1.6 million filers, is $1.6 million. Their total combined income exceeds $2.2 trillion, and amounted to 19% of all income in 2014. If today’s annual millionaires had to pay 1950’s tax rates, that last $600,000 of income would be worth not much more than $60,000 to them and $540,000 to the U.S. Treasury. The 90 percent rate was regarded as nothing out of the norm. 

Image result for U.S. income tax rates historical


Researchers find that in the ‘50s the effective tax rate for the one percent was 49% of all income. Today’s effective overall rate (state and local taxes included with federal) in 2014 is 33%. Also corporations paid on average 27% of all federal taxes instead of today’s 10%, the effective corporate tax rate was 40% not 27%. The ratio of CEO to worker compensation was  an amazing 20 to 1, not today’s frightening 231 to 1. The income share going to the top 1% of incomes was 10% not today’s 20%. Union membership would range in the low 30 percent, not today’s 6.6% in private enterprise. Wages and employment were stable and growing. 
                        

One very stark contrast with the 1950s is the story of America’s top-earning CEO in 1950, Charles Wilson, head of General Motors, the largest automaker in the world. One writer reports
“GM’s president “Engine Charlie” E. Wilson told Congress in 1953, ‘What’s good for America is good for General Motors, and vice versa.’ He took home $586,100 a year when the minimum wage was $0.75 an hour and gasoline was $0.27 a gallon.

During this time 80 percent of the world’s auto production and assembly was centered in Detroit. Back then GM was the world's largest corporation and had 46 percent of the American auto market. At its peak, the company employed more than 600,000 Americans.”
      Image result for "Charlie Wilson" "General Motors"             and on Time's cover.    
         
Adjusting for inflation Wilson’s income would be today $5.8 million. Today, a CEO earning “just” $5.8 million is less than mediocre. William Lazonic reports, “In 2012 the 500 highest-paid executives named in proxy statements of U.S. public companies received, on average, $30.3 million each; 42% of their compensation came from stock options and 41% from stock awards.” What’s more remarkable about Wilson’s income is comparing the pre-tax, $5.8 million, with the post-tax income, $1.6 million. He paid an effective tax rate of 73%. Contrast that with today’s effective tax rate for the top one percent at 33%. 


About 1.6 million tax filers reported in 2014 a pre-tax income of $1.6 million, according to the Congressional Joint Committee on Taxation (CJCT), page 29. Wilson’s post-tax income was $1.6 million, and his salary was the highest in America. Now there are 1.6 million with that same amount, $1.6 million in pre-tax income, and their post-tax income is around $1.1 million. (Again, in 1950 1 taxpayer had a post-tax income of $1.6 million, today 1.6 million men or women taxpayers have a pre-tax income of $1.6 million.) The American economy is much more productive than the 1950s, but producing a million more annual millionaire-incomes is not an accurate gauge of its growth. Instead it indicates the growth of the millionaire class to the expense of all other earning groups. 

The pre-tax income share for 0.9% of tax filers was 18.9% in 2014, according to the CJCT; one percent earned more than 55% who earned a 16.2% share. One percent earned 19%, five percent earned 34%, 20 percent earned 61%, and that leaves 39% for the lower eighty percent of tax filers to share among themselves. The group between the 50th and 80th percentiles earned 23%, and the lower 55 percent earned 16% — pre-tax income. 
See this revealing chart comparing income growth by income sectors 1947 to 1979, 1979 to 2007, and 2007 to 2013. And see this report from the CBPP with the "after-tax income" graph below --


Income Gains at the Top Dwarf Those of Low- and Middle-Income Households

Post-tax income reflects government taxes and transfers which assist low-income workers, their children, the poor, the  disabled, and elderly. The poverty rate in 2014 was cut from 31% of the U.S. population (pre-transfer) to 15.3% (post-transfer) according to the Supplemental Poverty Measure. Elderly above 65 years of age saw their poverty rate decreased from 50.0% to 14.4% through Social Security transfers. In all, about 6% of all income is transferred by Social Security, and another 8% in all the assistance  programs. Researchers at Columbia University state that poverty has been reduced since 1967 from 26% to 16% in 2012  and now to 15.3% in 2014. 


Image result for 1957 Chevy convertible


Today the ratio between the average income in the lower-earning 55 percent to the average in  top 1 percent is 1 to 69. The average income of a tax filer in the lower 55 percent, with income below $50,000, on average, is 69 times lower than the average of the top 1 percent, with income above $500,000. An easier way to remember this is to say that total combined income of two workers after 35 year careers is equal to one year’s income of one top-earning “one percenter”. (Two times 35 years is 70 years, and the ratio between the average income of the lower-earning 55% of U.S. workers to the average top one percent income is 1 to 69.) 

Is the lifetime work-contribution of two low-earning workers equal to one year of work from a top-earner? How do you measure? What would Charlie the Engine Wilson be thinking? “If it’s good for GM it’s good for America.” Today’s CEO will have another response, “We deserve it.” I doubt there is a convincing argument that justifies the one percent income group tripling its income in 30 years while the large group, of nonsupervisory workers comprising 80% of all workers, sees their annual income since 1962 decreasing by 5% in 54 years. And that’s what the studies and government agencies report. One study states, “Between 1979 and 2007, the top 1 percent took home well over half (53.9 percent) of the total increase in U.S. income. Over this period, the average income of the bottom 99 percent of U.S. taxpayers grew by 18.9 percent. Simultaneously, the average income of the top 1 percent grew over 10 times as much—by 200.5 percent.”
Image result for 1955 corvette

In 2016 we are are in a different world. The Bureau of Economic Analysis, Dept. of Commerce, shows that 1955 per capita “Disposable Personal Income” was $11,172, while in 2015 it was $38,050, nearly 4 times more in inflation adjusted dollars. On the positive side “market” or pre-tax poverty was reduced in 2012 by government transfers from 27.8% to 16.0%, a drop of 12.7%, while in 1967, the first year of measurement, the poverty rate moved from 27.0% to 25.8%, a drop of 1.2%. But negatively, jobs for the coming generation will pay less. Of the fastest growing 15 occupations, 11 pay between $18,410 and $31,200 a year. And labor union participation is a shadow of its former self; only 6.6% of private enterprise workers belong to a union instead of mid 30 percent in the 1950s. Oddly Canada to the north still has a labor union participation rate of 30 percent. The 1935 National Labor Relations Act has been stripped of its power by judicial amendment, and the chiefs of the unions have long called for scrapping the NLRA.


In 1956, at age 24, Floyd Patterson became the undisputed heavyweight champion of the world, the youngest boxer to achieve that title. In 1959 he was knocked out by Ingemar Johansen in their first fight. He came back winning the second. But he lost their third and last fight. He said, "They said I was the fighter who got knocked down the most, but I also got up the most.” We should be so lucky and plucky that some day we all might say the same. Down, but not out.   


As an after-thought I thought it useful to show the income distribution page from the Congressional Joint Committee on Taxation, Overview, 2015, page 28: