Where is that $25 Trillion?
The private wealth of the nation increased by $25 trillion since 2008. Did you get some of it?
OK, it was only $24.8 trillion. Where did it go? See the Federal Reserve report here, page 2.
(How this relates to the Ryan-Republican budget plan follows below this discussion of $25 trillion.)
How much is $24.8 trillion created over a six year period? It is $77,500 per citizen or $200,000 per household of new or additional wealth. (Divide $24.8 trillion by 320 million citizens). That's how much more wealth each American has since 2008. Every family of four will have $315,000 more savings since 2008 to add to their previous savings. Now the average family has almost $700,000 in total assets, not bad is it? It is a gain in national wealth of over 44% since 2008 while most families were struggling with declining home values, unemployment, loss of wages, and the worst economic collapse in 75 years. The per capita GDP between 2006 and 2012 increased by all of $3, from $48,905 to $48,908 (see this site to check). The national income, a composite of everyone's income, declined in 2008 for only the second time since 1933. But wealth began to skyrocket -- check the Federal Reserve report cited above.
Now the average wealth per human being in the U.S. is $254,000, and each household has $676,000 in savings, on average. But, in actual fact, only about 10% are average or above. Most of the $25 trillion went to just 5% of the households.
The lower-saving 50% -- half of America -- own just 1.1% of all savings (see here) and their average savings is below $14,000, not the average for all of $676,000. Inequality is the structural problem of our nation's economy, and our society. We must ask, does this affect the life opportunities of everyone, including the reader? Are we all poorer as a result of such extreme inequality? Is there an immense and immoral human suffering because many have NO access and many have little access to the immense resources that the nation possesses? Are we ignorant, heedless, or uncaring that we allow this distribution of resources to remain so one-sided.
I have difficulty explaining the economy. My friends and those I share my concerns with do not get it. The economy's main problem is that the immense "surplus" has not been shared adequately; the poor receive too little for their contributions, and the very wealthy seemingly hog most of the surplus. The result is a horrible distribution of total wealth that is beyond moral justification. Yet the most vociferous among us are silent, as though they must ignore this stupendous inequality.
Together the economy is a collective effort, but 40% of the workers only receive 4% of the annual income in wage income, check out the Social Security Administration's report on wage income. The annual surplus, which we call savings, profit, net worth, more-than-we-need-to-use-this-year, mostly goes to waste in excess savings of the very wealthiest. In order to save $25 trillion over a six year period when total output was around $90 trillion, some 28% of the output had to be saved. How else can one explain a gain of $25 trillion? (25 is 28% of 90) And during this period most were experiencing crushing wage decline, job loss, and housing value collapse. The median family lost 39% of its life savings according to the Federal Reserve (see page 2 and page 17), a drop from $124,000 to $77,000. But the national increase in net worth resulted from a splurge of wealth pouring into capital markets inflating financial assets, creating a bubble condition.
The new $24.8 trillion of savings increases each household's savings by $200,000, on average. Or $101,000 per adult. How many readers actually experienced this gain?
In contrast, about 47 million out of about 320 million Americans (about 1 in 7) cannot buy their food with money, instead they rely on the charity of food stamps (or its equivalent SNAP credits). They get $1.40 per meal, or $30.05 per week or $130 per month. What is a normal food expenditure per household? Let's look to the basic family budget analyzed by the EPI. It is $188.50 per month per person, or $43.50 per week per person, for a family living in Topeka, Kansas, the median expense location in the nation. The SNAP food budget is almost a third less than the basic frugal food budget. Instead of three meals a day, maybe food stamp recipients eat just two meals daily?
As a nation are we concerned about those one in seven American citizens, 47 million humans, who must rely on that $30 a week for food? How do we explain this failure in the wealthiest nation on the planet? Are these Americans stuck in a state of dependency on the government? Or is there a structural reason for their poverty, such as perhaps chronically low wages and inadequate job opportunities?
Lawrence Mishel published in the New York Times an op-ed that targets low wages as the primary source of the economy's troubles.
Here's an excerpt:
There is an solution, a way to reverse the trend. Briefly, you can go to Bernie Sanders' statement on the 12 proposals to turn the national economy in the correct direction. Or you can read on further in this blog, or review the blog list to the right here, particularly the EPI and its proposal of the Progressive Caucus budget. Sample idea: "
The economic solution lies in taxing the unused surplus that the wealthiest have coopted and waste in financial speculation and employ at a living wage in public jobs the capable but un-employed and under-employed and under-paid, which is about one in every four adult American workers -- one in four (I explain this 1 in 4 in the most recent posts. It is over 40 million workers.). Yes, we can be proud of our history, our heritage, our patriots, etc., but surely we can do better.
I could go on in detail about the means to spread prosperity, to spread the vast resources at hand, to spread the amazing $254,000 per citizen of personal savings or the near $700,000 per household savings, on average. Easily we all could have access to living wage employment. The CBO shows that the average market income per household is $93,900 per year (see page 2, here), and that translates into $72,000 per worker (on average) including all the unemployed workers. Each worker, even the unemployed and the part-timers, contribute $72,000 to the total national income. Yet 40% of all workers earn less than $20,000 a year and most of that 40% earn less than half that amount. The average wage income for the 40% (or 62 million workers) is just over $8,000 a year -- not $72,000. We could easily devise a way to share more equally these resources -- a true ownership society. (I explained this in a recent posting.) Figure it out, reader. We have plenty --- $81 trillions in savings, and over $12.7 trillion in annual income, according to the Joint Committee on Taxation, and $14 trillion according to the BEA.gov --- but millions are destitute and suffering, truly suffering. About 44% of citizens live in households where a $1,000 emergency expense is a disaster. And 40% of the adults self-identify as "lower or lower middle class". Soon the majority will self-identify as poor.

Most citizens are sleeping. We should be clamoring for real redistribution of resources. But the society is adrift, tragically unconcerned or unperplexed, often caught in a dog-eat-dog mentality, and cannot see its great potential.
______________________________________
Wikipedia's article on Income Inequality in the U.S. is an excellent and detailed reference that covers the full scope of the issue. It's an example of the power of "wiki". I highly recommend it.
I looked at the EPI article on international comparisons of "safety net" support for the poor, also an excellent reference. It concludes that the U.S. has a greater differential from low to middle to high incomes, and it also supports low income the least. I'm not convinced the report proves the last statement.
The U.S. Census finds that 48% of citizens are low-income or poor, from an article at Huffington Post.
Pew Research finds that 69% of Americans believe that government should do more to reduce inequality.
The Ryan-Republican Budget Plan
The Ryan budget, which is supported by all Republicans, would reduce by half the taxes on the wealthiest who earn more than $400,000 a year, and raise taxes by $788 on households earning $40,000 (see here, page 2 and 5). Tax increases would be served to three out of four Americans. Halving the tax rate on the wealthiest is hare-brained, to say the least, given that research shows that in the 28 years, 1979 to 2007, the top one percent has increased its income by 200% (a tripling) while the average weekly earnings of the lower 80% of earners has decreased by 2%(see here, Federal Reserve chart and convert for inflation, using this site).The per capita GDP expanded by 72% in this 28 year period, see here. An excerpt from the cited report:
"The average inflation-adjusted income of the bottom 99 percent of taxpayers grew by 18.9 percent between 1979 and 2007. Over the same period, the average income of the top 1 percent of taxpayers grew by 200.5 percent. This lopsided income growth means that the top 1 percent of taxpayers captured 53.9 percent of all income growth over the period."
An updated report shows that between 1979 and 2012 households in the lower 99% had 2.6% income growth and the top 1% had 180.9% growth. Does this mean its time to cut the taxes of the 1%?
According to Ryan and the Republicans, yes.
Ryan's budget would cut total tax revenues by 22% to 28%, and to compensate for the drop in revenue it would eliminate government programs serving the poor. About 69% of the cuts in program benefits eliminate serves to the poor elderly, the poor disabled, and poor children --- the politically defenseless. Read the report. The Tax Policy Institute predicts that since no new revenues are specified the national debt would climb from around 60% of GDP to 175% by year 2050. Ryan's budget would totally eliminate Medicaid, it would convert Medicare to a poorly funded voucher system, and it would privatize Social Security as well as raise the retirement age to 69.
I'll write a more detailed analysis someday. References for the above info can be found here, and here and here.
Here's an income perspective from the Joint Committee on Taxation, 2014, see page 30:
The wealthiest 5.2% of tax filers, earning over $200,000 yearly, earn 32.3% of all income, pay 70.0% of all income taxes, and 46.7% of all combined income and Social Security taxes. Most of Ryan's tax cuts would benefit the top-earning 5 percent. The fact that they earn almost a third of all income, own 75% of all financial assets, and more than half of all wealth -- that's the status quo that is anti-democratic and harmful. The Ryan Budget is a pay-off to the rich (campaign contributors) who make most of the campaign contributions. Two-thirds of all contributions came in amounts greater than $200 from just 0.5% of all U.S. adults -- see here. The wealthiest exclude, effectively, any candidate who would raise their taxes and reward those who would cut them in half. The Ryan budget is also an insult to intelligence, as it does not balance out as the proponents claim. It is Robin Hood in Reverse.


The private wealth of the nation increased by $25 trillion since 2008. Did you get some of it?
OK, it was only $24.8 trillion. Where did it go? See the Federal Reserve report here, page 2.
(How this relates to the Ryan-Republican budget plan follows below this discussion of $25 trillion.)
How much is $24.8 trillion created over a six year period? It is $77,500 per citizen or $200,000 per household of new or additional wealth. (Divide $24.8 trillion by 320 million citizens). That's how much more wealth each American has since 2008. Every family of four will have $315,000 more savings since 2008 to add to their previous savings. Now the average family has almost $700,000 in total assets, not bad is it? It is a gain in national wealth of over 44% since 2008 while most families were struggling with declining home values, unemployment, loss of wages, and the worst economic collapse in 75 years. The per capita GDP between 2006 and 2012 increased by all of $3, from $48,905 to $48,908 (see this site to check). The national income, a composite of everyone's income, declined in 2008 for only the second time since 1933. But wealth began to skyrocket -- check the Federal Reserve report cited above.
Now the average wealth per human being in the U.S. is $254,000, and each household has $676,000 in savings, on average. But, in actual fact, only about 10% are average or above. Most of the $25 trillion went to just 5% of the households.
The lower-saving 50% -- half of America -- own just 1.1% of all savings (see here) and their average savings is below $14,000, not the average for all of $676,000. Inequality is the structural problem of our nation's economy, and our society. We must ask, does this affect the life opportunities of everyone, including the reader? Are we all poorer as a result of such extreme inequality? Is there an immense and immoral human suffering because many have NO access and many have little access to the immense resources that the nation possesses? Are we ignorant, heedless, or uncaring that we allow this distribution of resources to remain so one-sided.
I have difficulty explaining the economy. My friends and those I share my concerns with do not get it. The economy's main problem is that the immense "surplus" has not been shared adequately; the poor receive too little for their contributions, and the very wealthy seemingly hog most of the surplus. The result is a horrible distribution of total wealth that is beyond moral justification. Yet the most vociferous among us are silent, as though they must ignore this stupendous inequality.
Together the economy is a collective effort, but 40% of the workers only receive 4% of the annual income in wage income, check out the Social Security Administration's report on wage income. The annual surplus, which we call savings, profit, net worth, more-than-we-need-to-use-this-year, mostly goes to waste in excess savings of the very wealthiest. In order to save $25 trillion over a six year period when total output was around $90 trillion, some 28% of the output had to be saved. How else can one explain a gain of $25 trillion? (25 is 28% of 90) And during this period most were experiencing crushing wage decline, job loss, and housing value collapse. The median family lost 39% of its life savings according to the Federal Reserve (see page 2 and page 17), a drop from $124,000 to $77,000. But the national increase in net worth resulted from a splurge of wealth pouring into capital markets inflating financial assets, creating a bubble condition.
The new $24.8 trillion of savings increases each household's savings by $200,000, on average. Or $101,000 per adult. How many readers actually experienced this gain?
In contrast, about 47 million out of about 320 million Americans (about 1 in 7) cannot buy their food with money, instead they rely on the charity of food stamps (or its equivalent SNAP credits). They get $1.40 per meal, or $30.05 per week or $130 per month. What is a normal food expenditure per household? Let's look to the basic family budget analyzed by the EPI. It is $188.50 per month per person, or $43.50 per week per person, for a family living in Topeka, Kansas, the median expense location in the nation. The SNAP food budget is almost a third less than the basic frugal food budget. Instead of three meals a day, maybe food stamp recipients eat just two meals daily?
As a nation are we concerned about those one in seven American citizens, 47 million humans, who must rely on that $30 a week for food? How do we explain this failure in the wealthiest nation on the planet? Are these Americans stuck in a state of dependency on the government? Or is there a structural reason for their poverty, such as perhaps chronically low wages and inadequate job opportunities?
Lawrence Mishel published in the New York Times an op-ed that targets low wages as the primary source of the economy's troubles.
Here's an excerpt:
WASHINGTON — WITH the early stages of the 2016 presidential campaign underway and millions of Americans still hurting financially, both parties are looking for ways to address wage stagnation. That’s the good news. The bad news is that both parties are offering tax cuts as a solution. What has hurt workers’ paychecks is not what the government takes out, but what their employers no longer put in — a dynamic that tax cuts cannot eliminate.
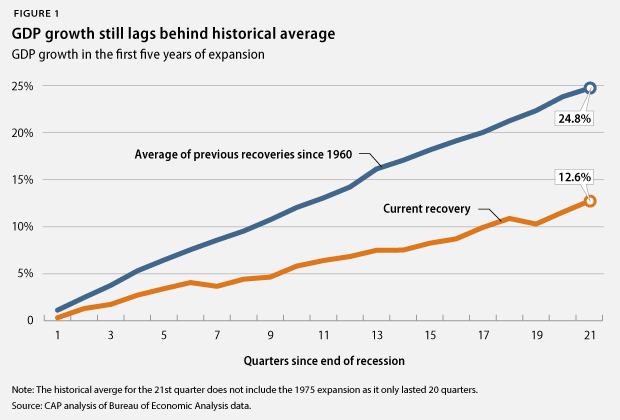
Wage stagnation is a decades-long phenomenon. Between 1979 and 2014, while the gross domestic product grew 150 percent and productivity grew 75 percent, the inflation-adjusted hourly wage of the median worker rose just 5.6 percent — less than 0.2 percent a year. And since 2002, the bottom 80 percent of wage earners, including both male and female college graduates, have actually seen their wages stagnate or fall."
There is an solution, a way to reverse the trend. Briefly, you can go to Bernie Sanders' statement on the 12 proposals to turn the national economy in the correct direction. Or you can read on further in this blog, or review the blog list to the right here, particularly the EPI and its proposal of the Progressive Caucus budget. Sample idea: "
- Make necessary public investments. The [P C] budget finances roughly $485 billion in job creation and public investment measures in calendar year 2014 alone and roughly $1.35 trillion over calendar years 2014–2016.3 This fiscal expansion is consistent with the amount of fiscal support needed to rapidly shrink the “output gap” and restore the economy to full health.
The economic solution lies in taxing the unused surplus that the wealthiest have coopted and waste in financial speculation and employ at a living wage in public jobs the capable but un-employed and under-employed and under-paid, which is about one in every four adult American workers -- one in four (I explain this 1 in 4 in the most recent posts. It is over 40 million workers.). Yes, we can be proud of our history, our heritage, our patriots, etc., but surely we can do better.
I could go on in detail about the means to spread prosperity, to spread the vast resources at hand, to spread the amazing $254,000 per citizen of personal savings or the near $700,000 per household savings, on average. Easily we all could have access to living wage employment. The CBO shows that the average market income per household is $93,900 per year (see page 2, here), and that translates into $72,000 per worker (on average) including all the unemployed workers. Each worker, even the unemployed and the part-timers, contribute $72,000 to the total national income. Yet 40% of all workers earn less than $20,000 a year and most of that 40% earn less than half that amount. The average wage income for the 40% (or 62 million workers) is just over $8,000 a year -- not $72,000. We could easily devise a way to share more equally these resources -- a true ownership society. (I explained this in a recent posting.) Figure it out, reader. We have plenty --- $81 trillions in savings, and over $12.7 trillion in annual income, according to the Joint Committee on Taxation, and $14 trillion according to the BEA.gov --- but millions are destitute and suffering, truly suffering. About 44% of citizens live in households where a $1,000 emergency expense is a disaster. And 40% of the adults self-identify as "lower or lower middle class". Soon the majority will self-identify as poor.
Most citizens are sleeping. We should be clamoring for real redistribution of resources. But the society is adrift, tragically unconcerned or unperplexed, often caught in a dog-eat-dog mentality, and cannot see its great potential.
______________________________________
Wikipedia's article on Income Inequality in the U.S. is an excellent and detailed reference that covers the full scope of the issue. It's an example of the power of "wiki". I highly recommend it.
I looked at the EPI article on international comparisons of "safety net" support for the poor, also an excellent reference. It concludes that the U.S. has a greater differential from low to middle to high incomes, and it also supports low income the least. I'm not convinced the report proves the last statement.
The U.S. Census finds that 48% of citizens are low-income or poor, from an article at Huffington Post.
Pew Research finds that 69% of Americans believe that government should do more to reduce inequality.
The Ryan-Republican Budget Plan
The Ryan budget, which is supported by all Republicans, would reduce by half the taxes on the wealthiest who earn more than $400,000 a year, and raise taxes by $788 on households earning $40,000 (see here, page 2 and 5). Tax increases would be served to three out of four Americans. Halving the tax rate on the wealthiest is hare-brained, to say the least, given that research shows that in the 28 years, 1979 to 2007, the top one percent has increased its income by 200% (a tripling) while the average weekly earnings of the lower 80% of earners has decreased by 2%(see here, Federal Reserve chart and convert for inflation, using this site).The per capita GDP expanded by 72% in this 28 year period, see here. An excerpt from the cited report:
"The average inflation-adjusted income of the bottom 99 percent of taxpayers grew by 18.9 percent between 1979 and 2007. Over the same period, the average income of the top 1 percent of taxpayers grew by 200.5 percent. This lopsided income growth means that the top 1 percent of taxpayers captured 53.9 percent of all income growth over the period."
An updated report shows that between 1979 and 2012 households in the lower 99% had 2.6% income growth and the top 1% had 180.9% growth. Does this mean its time to cut the taxes of the 1%?
According to Ryan and the Republicans, yes.
Ryan's budget would cut total tax revenues by 22% to 28%, and to compensate for the drop in revenue it would eliminate government programs serving the poor. About 69% of the cuts in program benefits eliminate serves to the poor elderly, the poor disabled, and poor children --- the politically defenseless. Read the report. The Tax Policy Institute predicts that since no new revenues are specified the national debt would climb from around 60% of GDP to 175% by year 2050. Ryan's budget would totally eliminate Medicaid, it would convert Medicare to a poorly funded voucher system, and it would privatize Social Security as well as raise the retirement age to 69.
I'll write a more detailed analysis someday. References for the above info can be found here, and here and here.
Here's an income perspective from the Joint Committee on Taxation, 2014, see page 30:
The wealthiest 5.2% of tax filers, earning over $200,000 yearly, earn 32.3% of all income, pay 70.0% of all income taxes, and 46.7% of all combined income and Social Security taxes. Most of Ryan's tax cuts would benefit the top-earning 5 percent. The fact that they earn almost a third of all income, own 75% of all financial assets, and more than half of all wealth -- that's the status quo that is anti-democratic and harmful. The Ryan Budget is a pay-off to the rich (campaign contributors) who make most of the campaign contributions. Two-thirds of all contributions came in amounts greater than $200 from just 0.5% of all U.S. adults -- see here. The wealthiest exclude, effectively, any candidate who would raise their taxes and reward those who would cut them in half. The Ryan budget is also an insult to intelligence, as it does not balance out as the proponents claim. It is Robin Hood in Reverse.